 19
19peptides
spectra
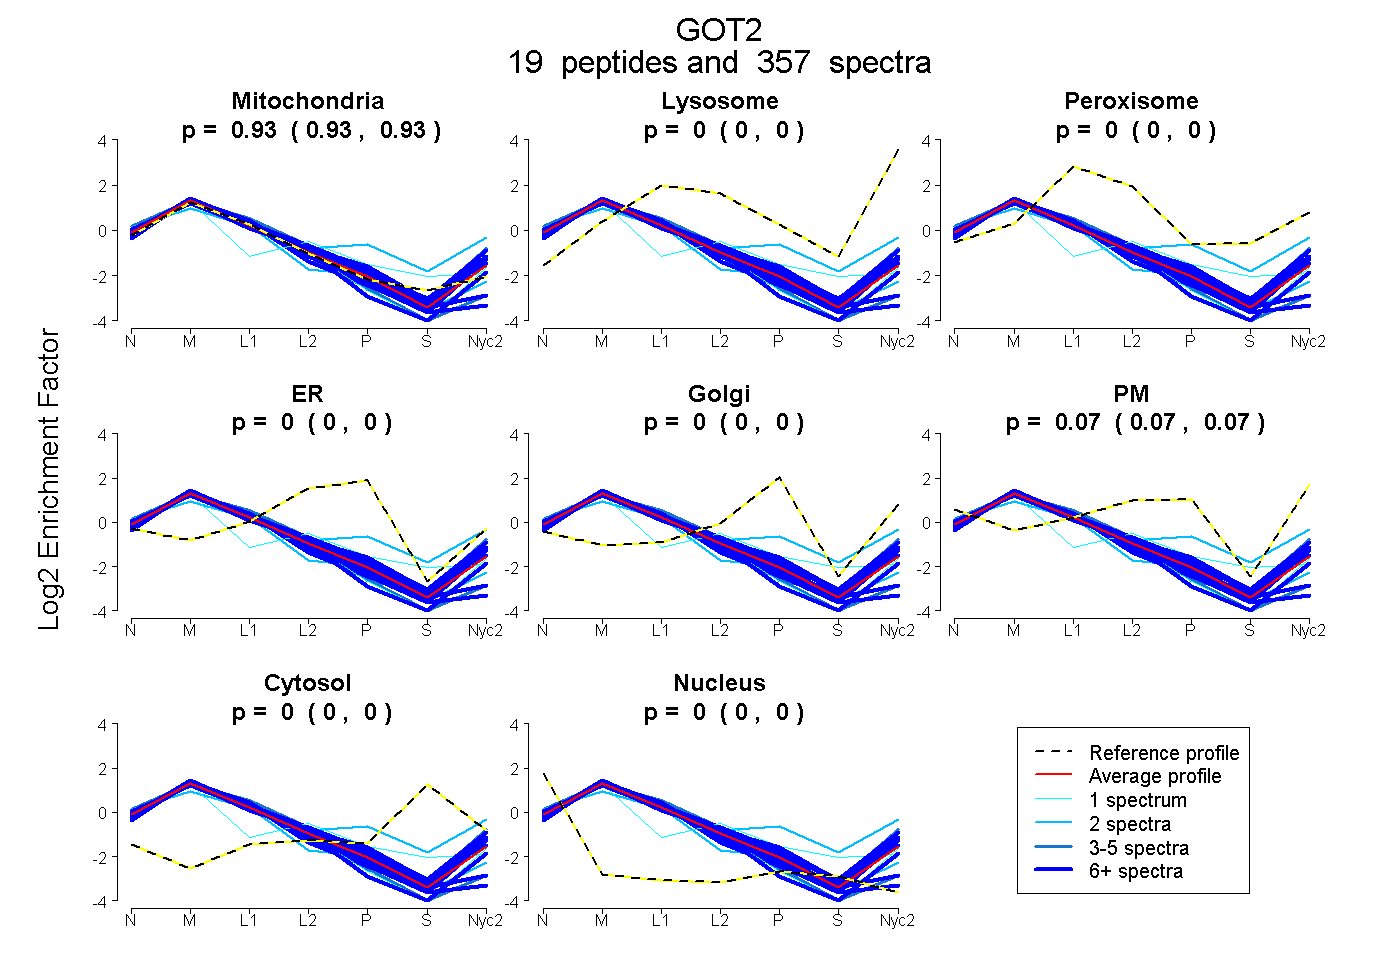
0.929 | 0.933
0.000 | 0.000
0.000 | 0.000
0.000 | 0.000
0.000 | 0.000
0.067 | 0.071
0.000 | 0.000
0.000 | 0.000
21peptides
spectra
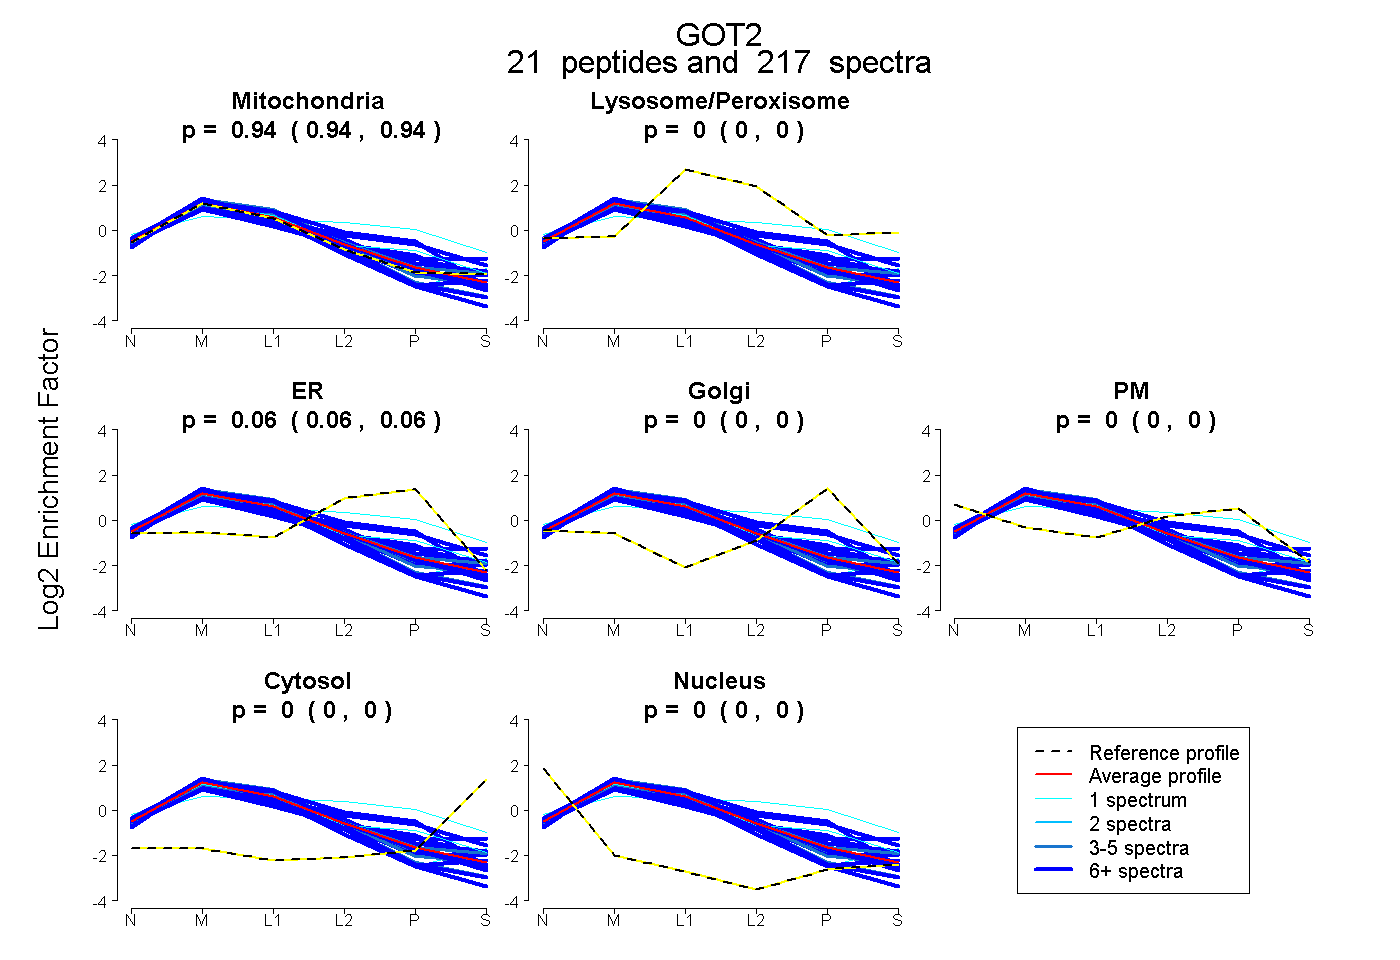
0.936 | 0.942
0.000 | 0.000
0.057 | 0.063
0.000 | 0.000
0.000 | 0.000
0.000 | 0.000
0.000 | 0.000
24peptides
spectra
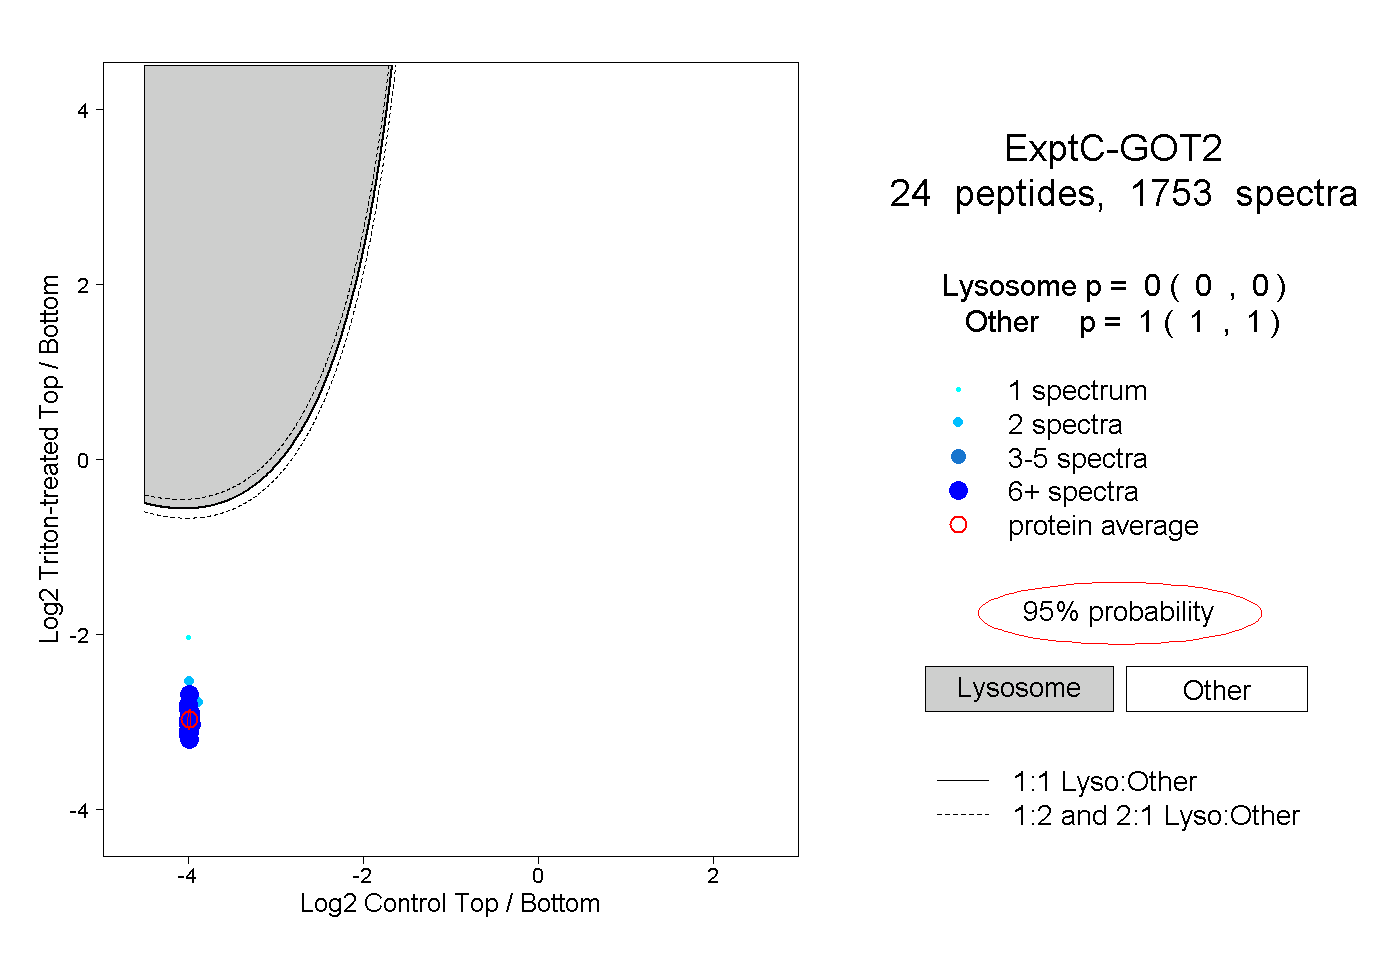
0.000 | 0.000
1.000 | 1.000
17peptides
spectra
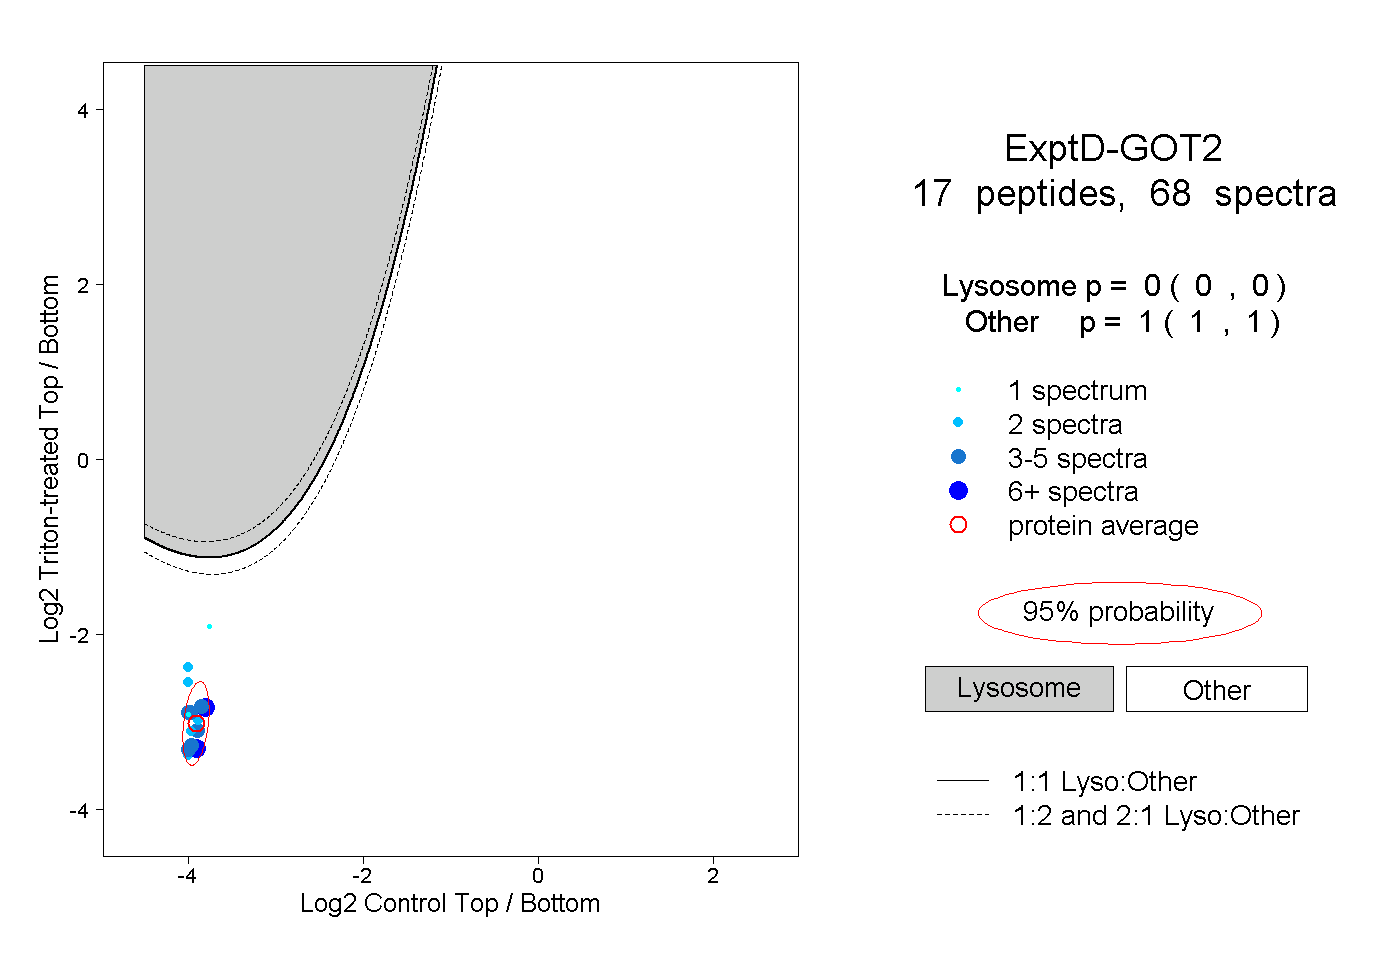
0.000 | 0.000
1.000 | 1.000