 19
19peptides
spectra
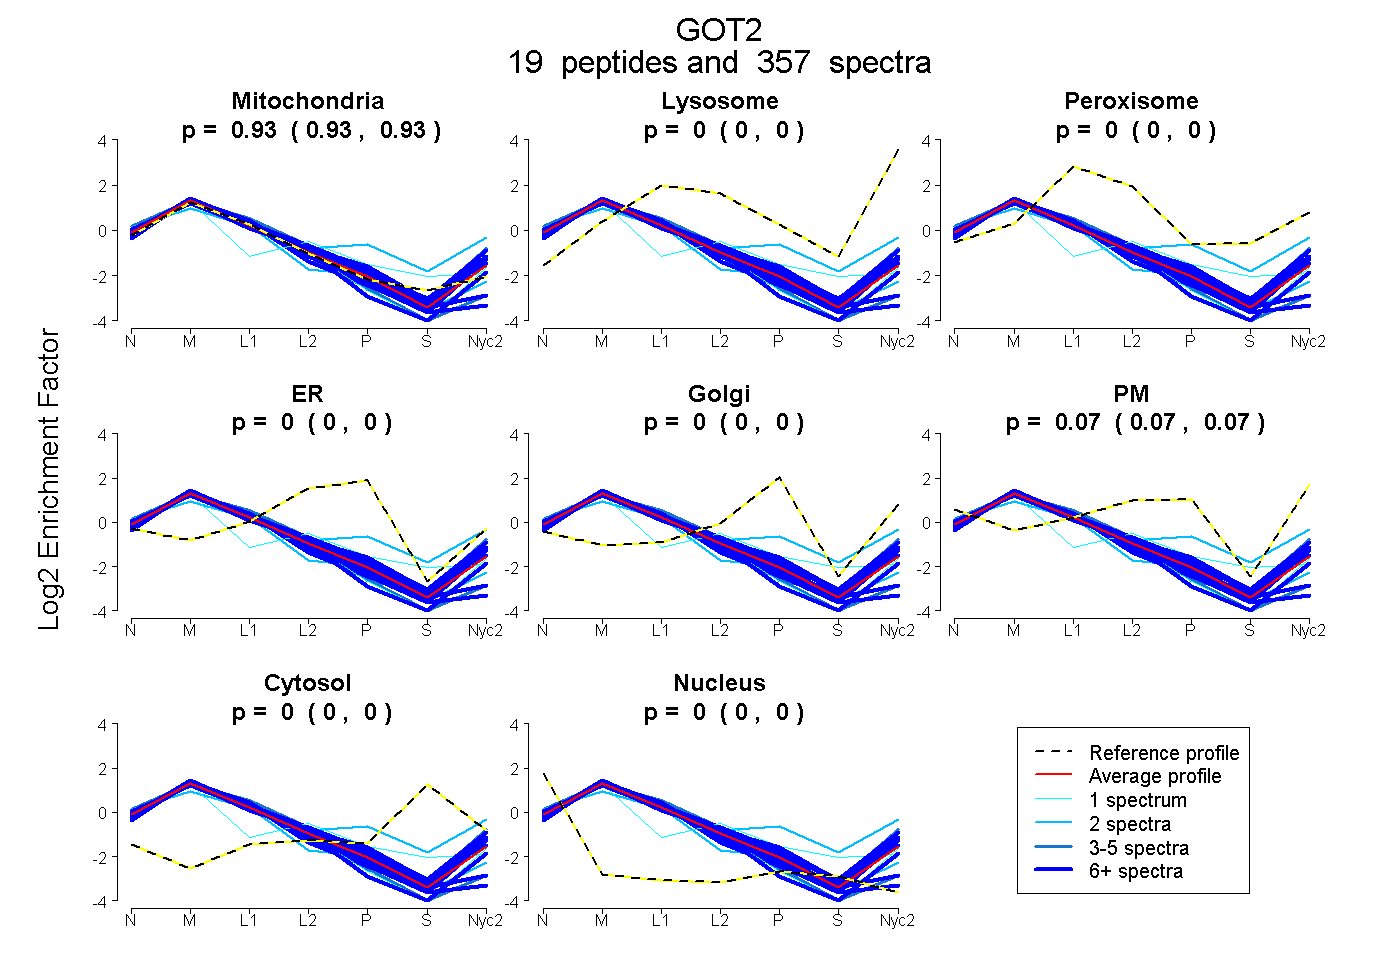
0.929 | 0.933
0.000 | 0.000
0.000 | 0.000
0.000 | 0.000
0.000 | 0.000
0.067 | 0.071
0.000 | 0.000
0.000 | 0.000
| Plot | Mito | Lyso | Perox | ER | Golgi | PM | Cytosol | Nucleus | |||||
| Expt A |
19 peptides |
357 spectra |
|
0.931 0.929 | 0.933 |
0.000 0.000 | 0.000 |
0.000 0.000 | 0.000 |
0.000 0.000 | 0.000 |
0.000 0.000 | 0.000 |
0.069 0.067 | 0.071 |
0.000 0.000 | 0.000 |
0.000 0.000 | 0.000 |
| 9 spectra, EYLPIGGLADFCK | 0.944 | 0.000 | 0.000 | 0.000 | 0.000 | 0.000 | 0.000 | 0.056 | ||
| 41 spectra, MNLGVGAYR | 0.894 | 0.018 | 0.000 | 0.000 | 0.000 | 0.087 | 0.000 | 0.000 | ||
| 1 spectrum, IAATILTSPDLR | 1.000 | 0.000 | 0.000 | 0.000 | 0.000 | 0.000 | 0.000 | 0.000 | ||
| 1 spectrum, HFIEQGINVCLCQSYAK | 0.773 | 0.000 | 0.000 | 0.036 | 0.083 | 0.000 | 0.078 | 0.031 | ||
| 7 spectra, TCGFDFSGALEDISK | 1.000 | 0.000 | 0.000 | 0.000 | 0.000 | 0.000 | 0.000 | 0.000 | ||
| 45 spectra, VGASFLQR | 0.894 | 0.000 | 0.000 | 0.000 | 0.000 | 0.106 | 0.000 | 0.000 | ||
| 21 spectra, VGAFTVVCK | 0.945 | 0.000 | 0.000 | 0.000 | 0.000 | 0.000 | 0.000 | 0.055 | ||
| 41 spectra, NMGLYGER | 0.819 | 0.050 | 0.000 | 0.000 | 0.000 | 0.130 | 0.000 | 0.000 | ||
| 76 spectra, DAGMQLQGYR | 0.934 | 0.000 | 0.000 | 0.000 | 0.000 | 0.066 | 0.000 | 0.000 | ||
| 13 spectra, QWLQEVK | 0.814 | 0.000 | 0.000 | 0.000 | 0.000 | 0.186 | 0.000 | 0.000 | ||
| 2 spectra, DAEEAK | 0.962 | 0.000 | 0.000 | 0.000 | 0.000 | 0.000 | 0.000 | 0.038 | ||
| 3 spectra, AEAQIAGK | 0.953 | 0.000 | 0.000 | 0.000 | 0.000 | 0.000 | 0.000 | 0.047 | ||
| 3 spectra, ASAELALGENSEVLK | 0.880 | 0.120 | 0.000 | 0.000 | 0.000 | 0.000 | 0.000 | 0.000 | ||
| 16 spectra, TQLVSNLK | 0.857 | 0.000 | 0.000 | 0.000 | 0.000 | 0.143 | 0.000 | 0.000 | ||
| 12 spectra, DDNGKPYVLPSVR | 0.836 | 0.000 | 0.000 | 0.000 | 0.000 | 0.164 | 0.000 | 0.000 | ||
| 10 spectra, EMAAVVK | 0.876 | 0.029 | 0.000 | 0.000 | 0.000 | 0.095 | 0.000 | 0.000 | ||
| 27 spectra, EFSVYMTK | 0.919 | 0.000 | 0.000 | 0.000 | 0.000 | 0.081 | 0.000 | 0.000 | ||
| 27 spectra, FVTVQTISGTGALR | 0.897 | 0.000 | 0.000 | 0.000 | 0.000 | 0.103 | 0.000 | 0.000 | ||
| 2 spectra, DAWAVR | 0.567 | 0.070 | 0.000 | 0.000 | 0.058 | 0.250 | 0.055 | 0.000 |
| Plot | Mito | Lyso or Perox | ER | Golgi | PM | Cytosol | Nucleus | ||||||
| Expt B |
21 peptides |
217 spectra |
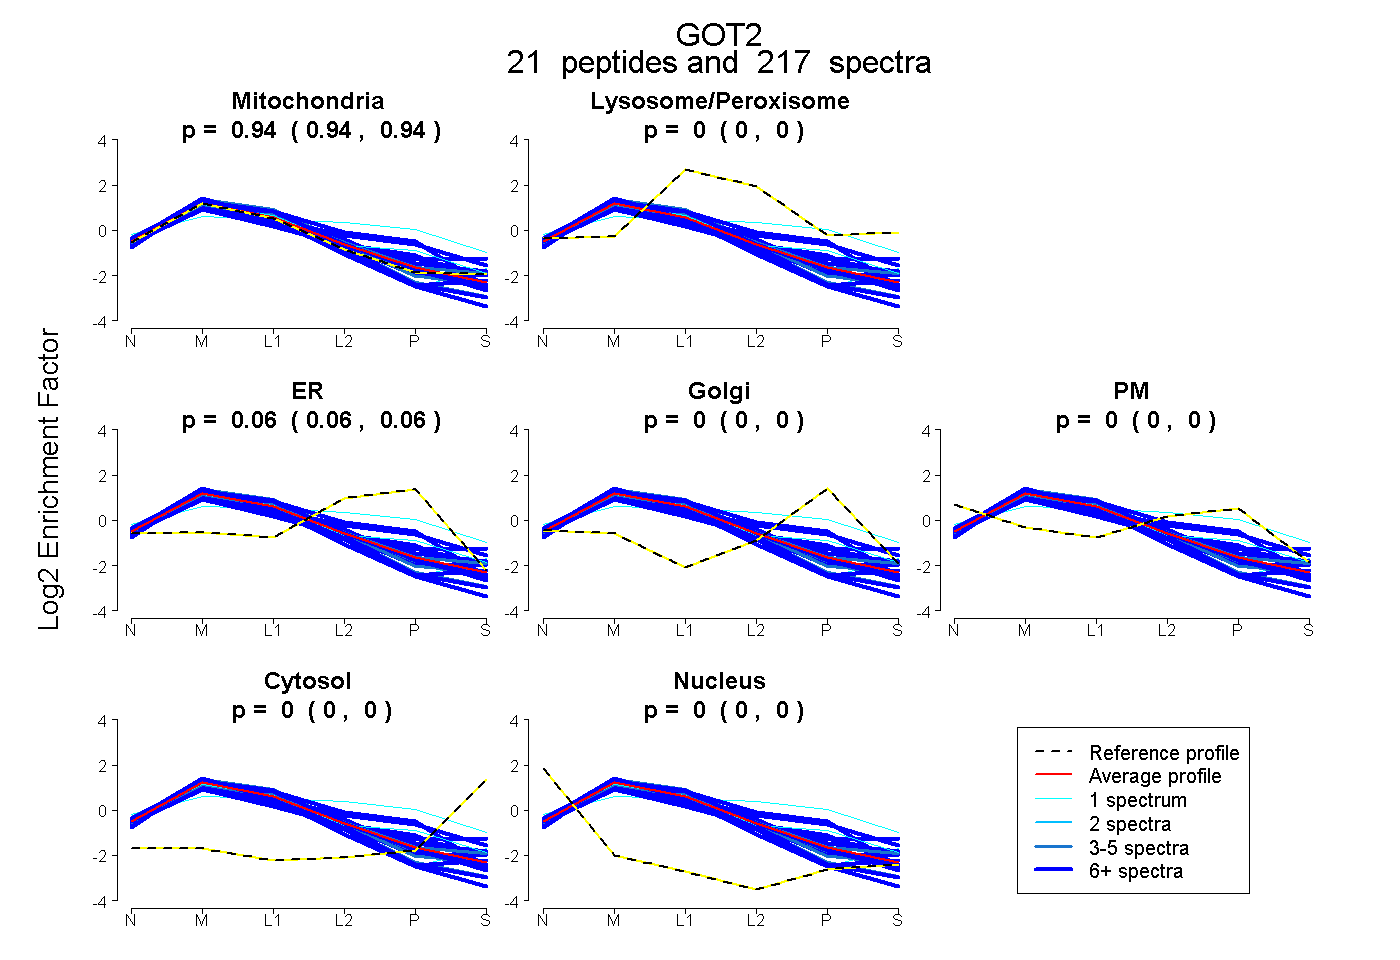 |
0.939 0.936 | 0.942 |
0.000 0.000 | 0.000 |
0.061 0.057 | 0.063 |
0.000 0.000 | 0.000 |
0.000 0.000 | 0.000 |
0.000 0.000 | 0.000 |
0.000 0.000 | 0.000 |
|||
| Plot | Lyso | Other | |||||||||||
| Expt C |
24 peptides |
1753 spectra |
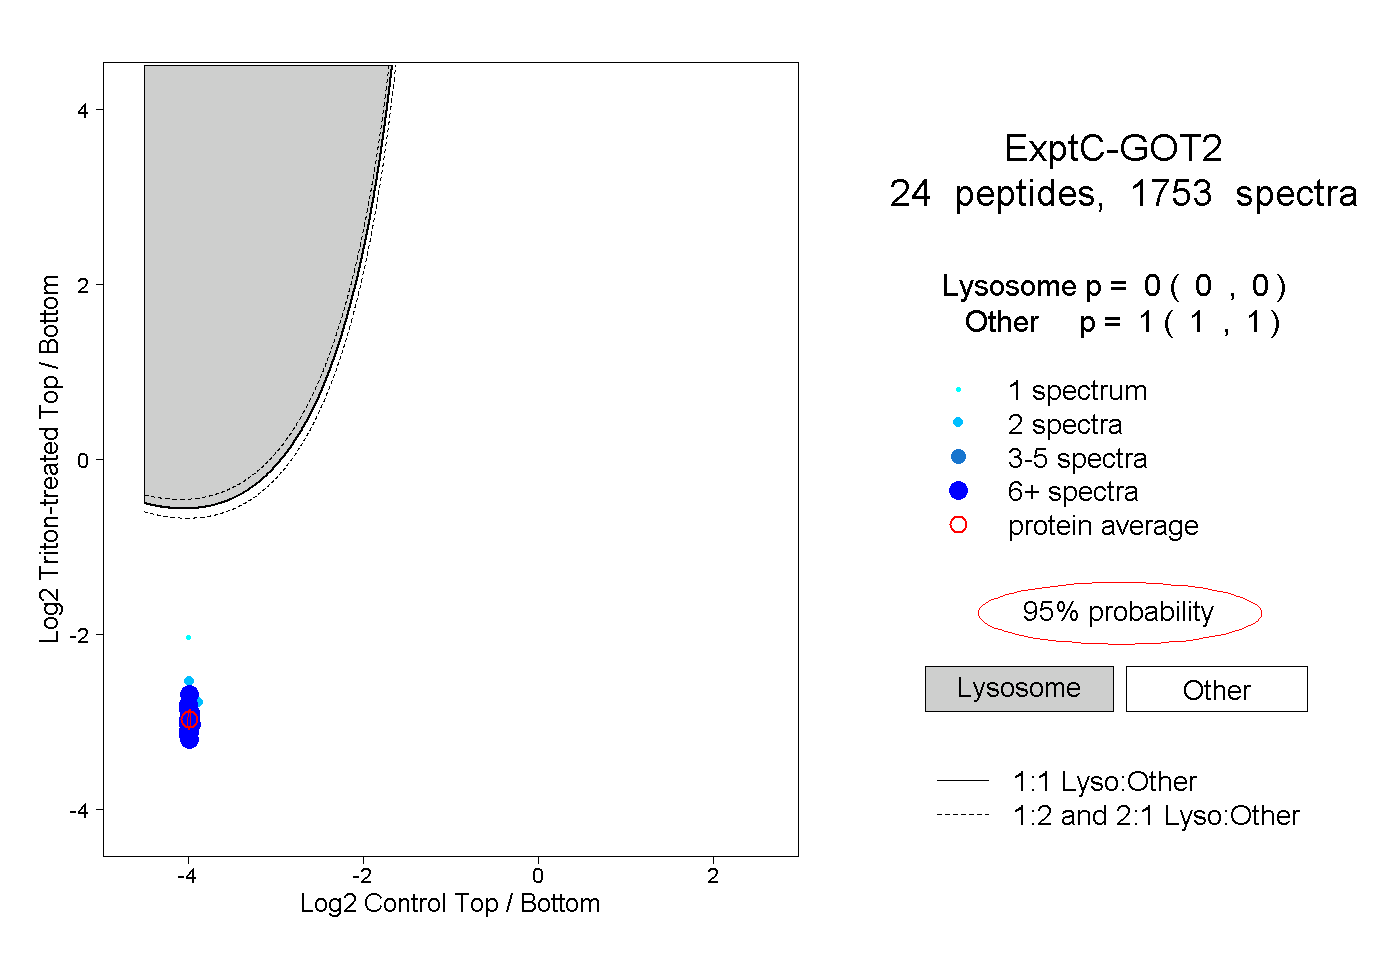 |
0.000 0.000 | 0.000 |
1.000 1.000 | 1.000 |
||||||||
| Plot | Lyso | Other | |||||||||||
| Expt D |
17 peptides |
68 spectra |
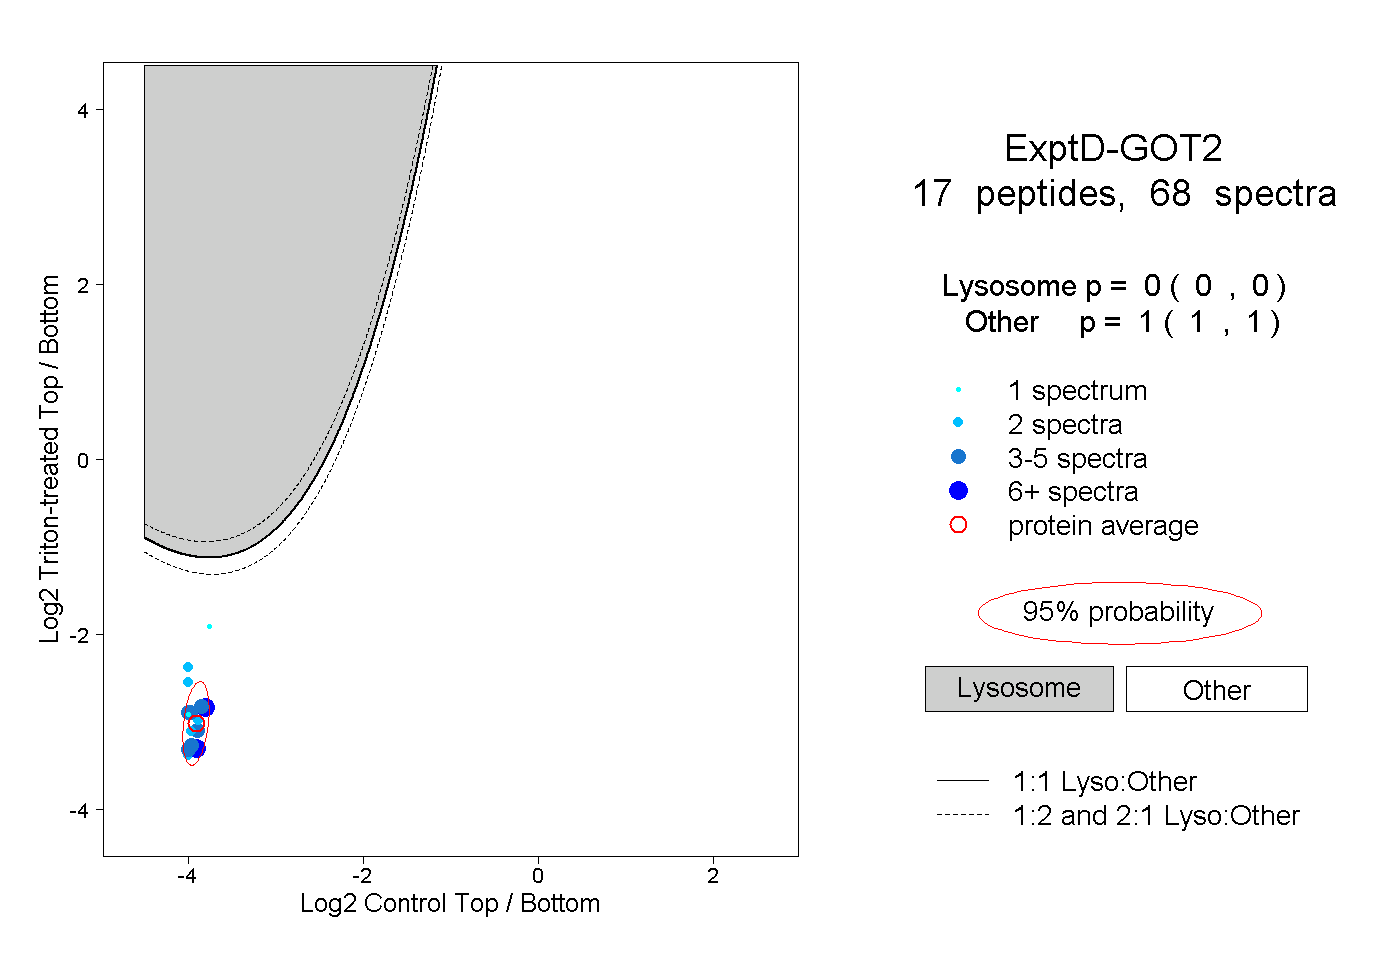 |
0.000 0.000 | 0.000 |
1.000 1.000 | 1.000 |