 4
4peptides
spectra
0.000 | 0.000
0.395 | 0.588
0.000 | 0.125
0.000 | 0.000
0.000 | 0.000
0.187 | 0.249
0.197 | 0.241
0.000 | 0.000
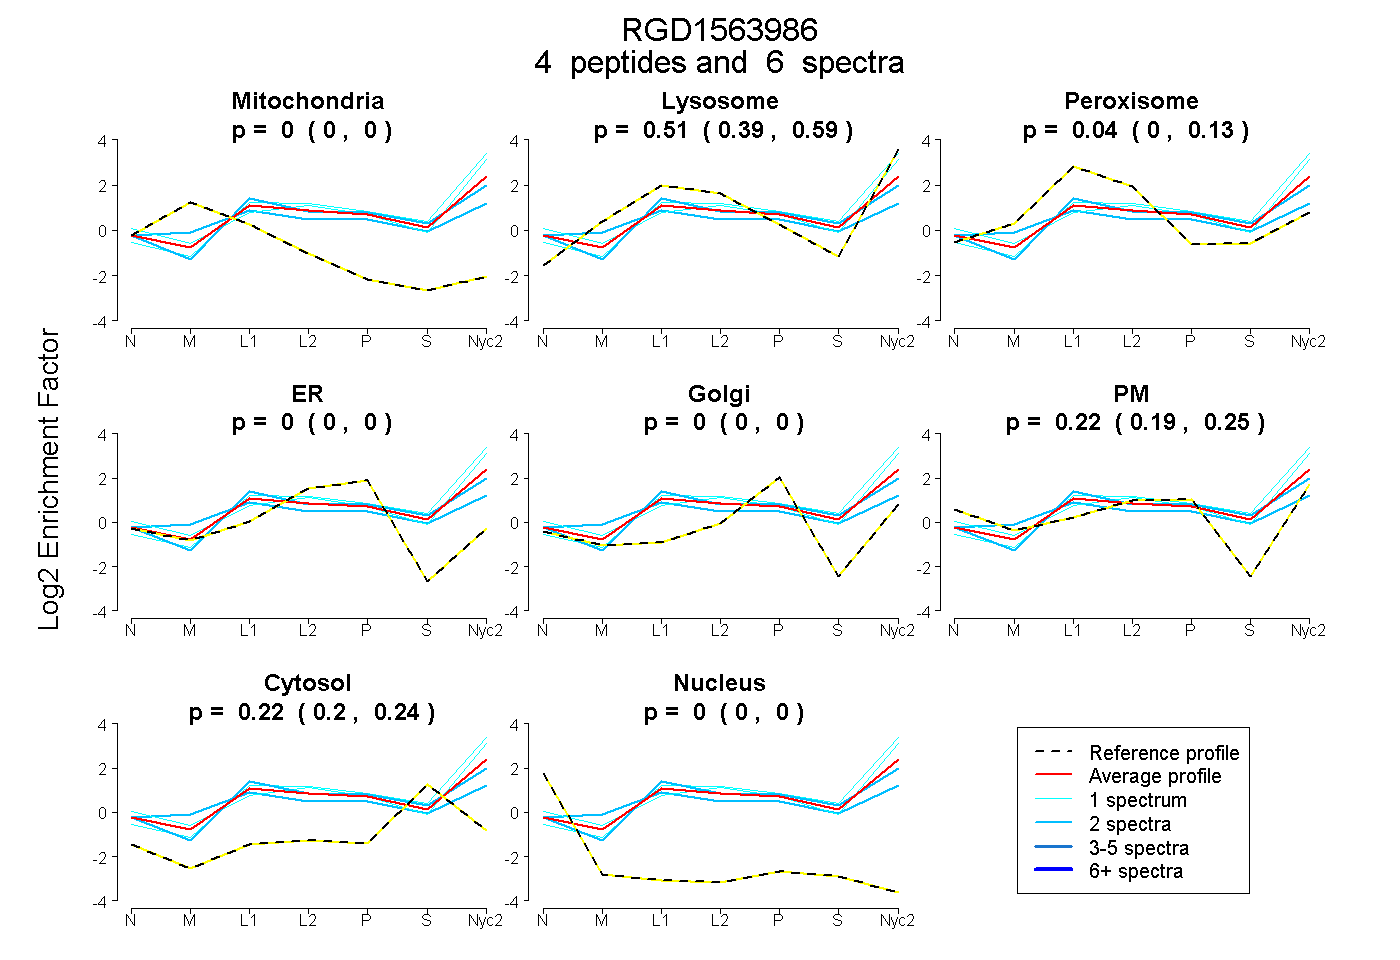
| Plot | Mito | Lyso | Perox | ER | Golgi | PM | Cytosol | Nucleus | |||||
| Expt A |
4 peptides |
6 spectra |
|
0.000 0.000 | 0.000 |
0.510 0.395 | 0.588 |
0.045 0.000 | 0.125 |
0.000 0.000 | 0.000 |
0.000 0.000 | 0.000 |
0.223 0.187 | 0.249 |
0.222 0.197 | 0.241 |
0.000 0.000 | 0.000 |
| 2 spectra, VAAEAPR | 0.000 | 0.384 | 0.170 | 0.000 | 0.000 | 0.195 | 0.251 | 0.000 | ||
| 1 spectrum, TLTAEHAR | 0.000 | 0.554 | 0.000 | 0.000 | 0.000 | 0.302 | 0.145 | 0.000 | ||
| 2 spectra, EPEEPAPPEVLLQPGR | 0.000 | 0.173 | 0.316 | 0.000 | 0.099 | 0.194 | 0.217 | 0.000 | ||
| 1 spectrum, SVGILSPSYTLLYR | 0.000 | 0.741 | 0.000 | 0.000 | 0.000 | 0.062 | 0.198 | 0.000 |
| Plot | Lyso | Other | |||||||||||
| Expt C |
7 peptides |
11 spectra |
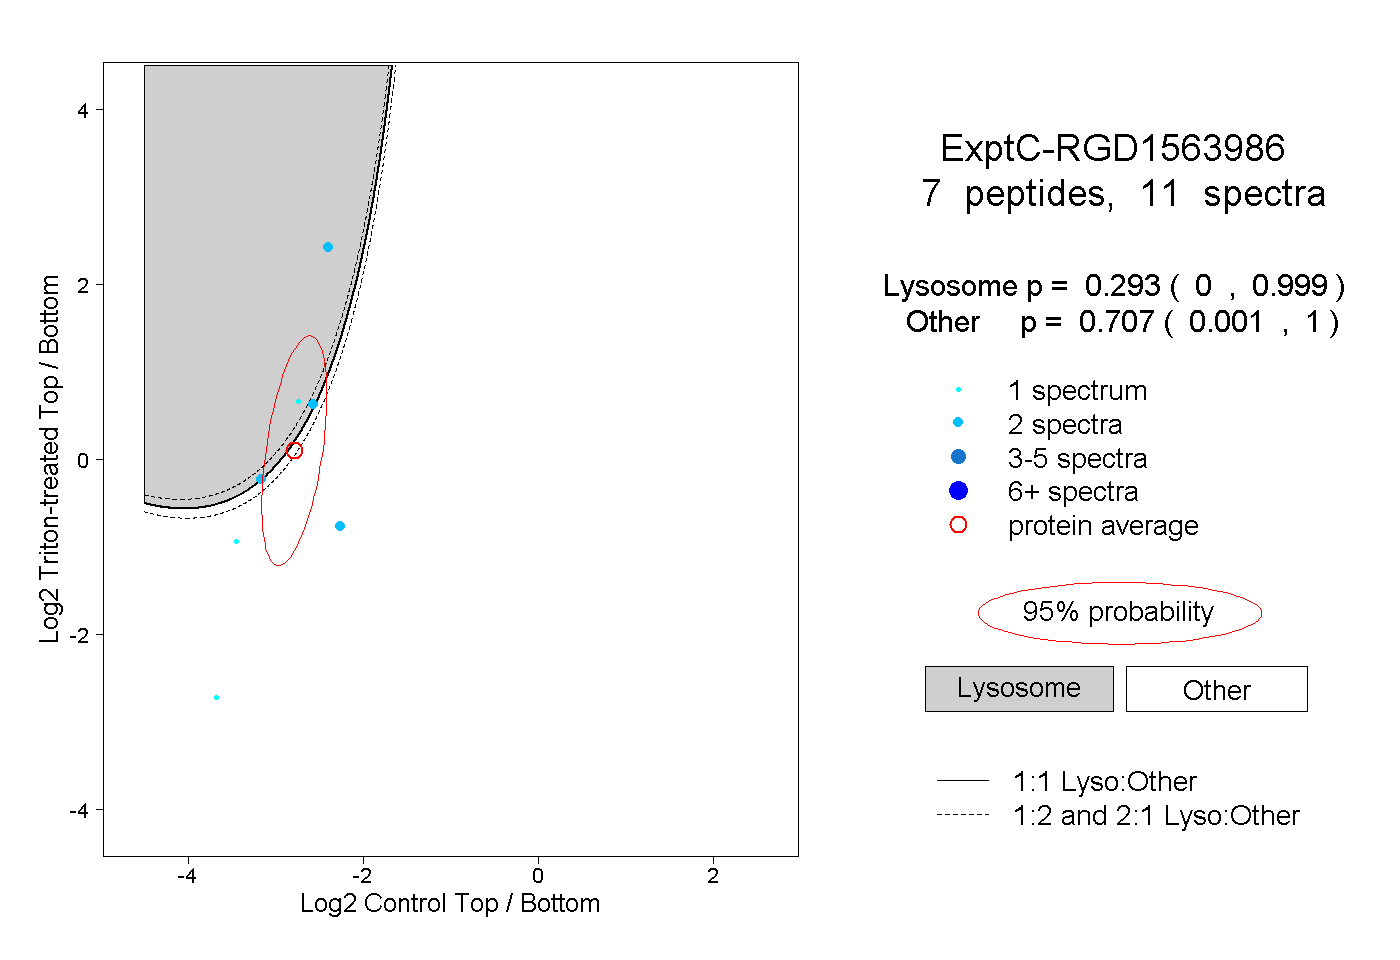 |
0.293 0.000 | 0.999 |
0.707 0.001 | 1.000 |