 3
3peptides
spectra

0.000 | 0.000
0.000 | 0.000
0.000 | 0.000
0.031 | 0.337
0.164 | 0.509
0.000 | 0.000
0.313 | 0.491
0.000 | 0.081
| Plot | Mito | Lyso | Perox | ER | Golgi | PM | Cytosol | Nucleus | |||||
| Expt A |
3 peptides |
8 spectra |
|
0.000 0.000 | 0.000 |
0.000 0.000 | 0.000 |
0.000 0.000 | 0.000 |
0.199 0.031 | 0.337 |
0.351 0.164 | 0.509 |
0.000 0.000 | 0.000 |
0.415 0.313 | 0.491 |
0.035 0.000 | 0.081 |
| 2 spectra, QVVQATAEQMR | 0.000 | 0.000 | 0.000 | 0.028 | 0.495 | 0.000 | 0.204 | 0.274 | ||
| 1 spectrum, NQDECIVALHDCNGDVNK | 0.159 | 0.000 | 0.144 | 0.095 | 0.536 | 0.000 | 0.066 | 0.000 | ||
| 5 spectra, GGYGGSSQAPNK | 0.000 | 0.000 | 0.000 | 0.121 | 0.198 | 0.000 | 0.681 | 0.000 |
| Plot | Lyso | Other | |||||||||||
| Expt C |
2 peptides |
3 spectra |
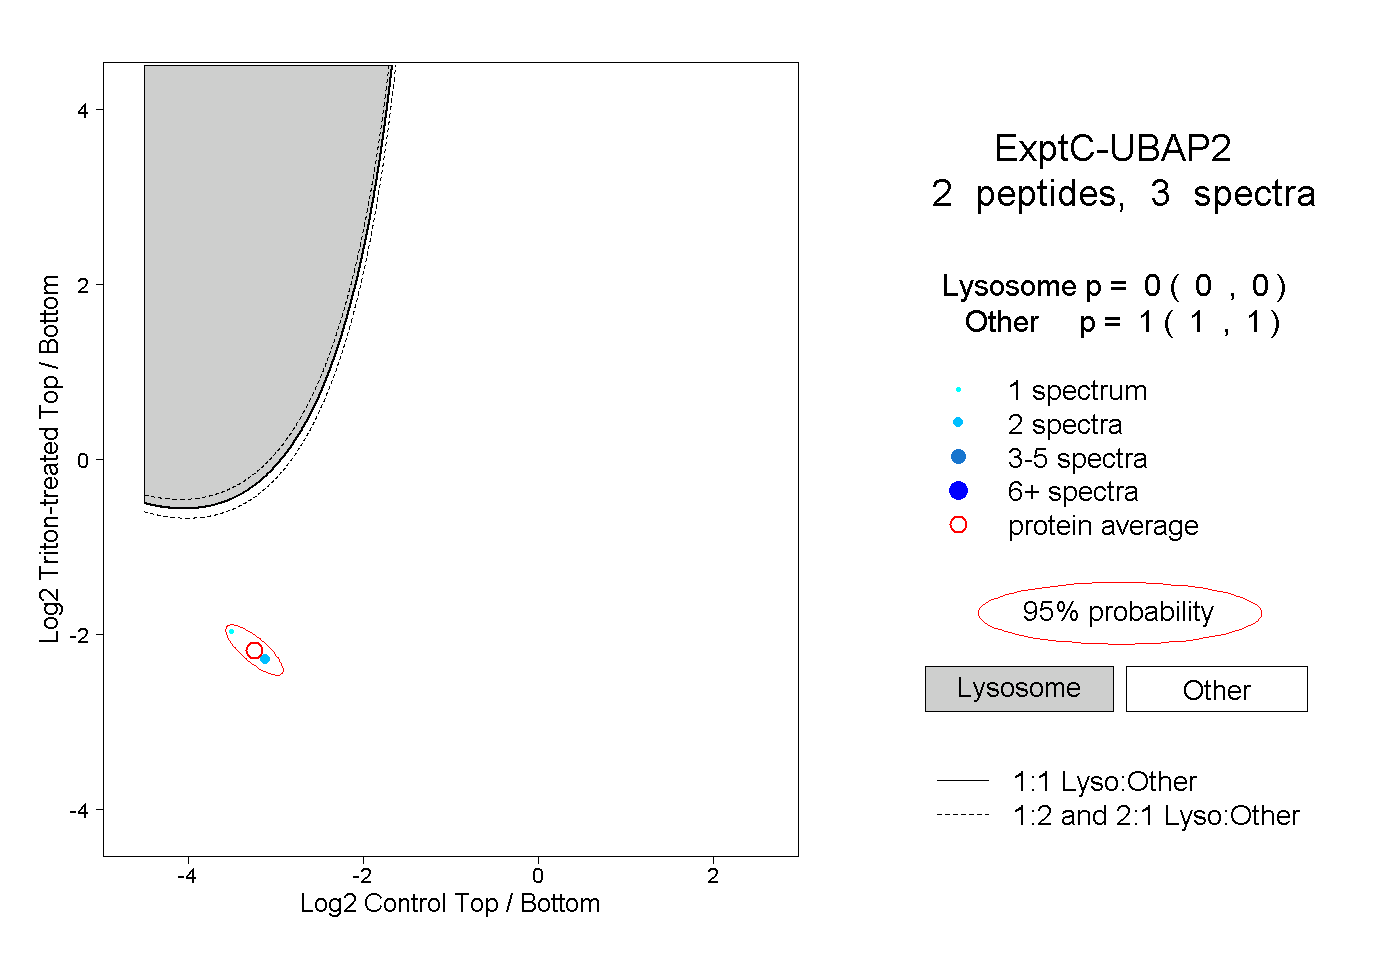 |
0.000 0.000 | 0.000 |
1.000 1.000 | 1.000 |