 18
18peptides
spectra
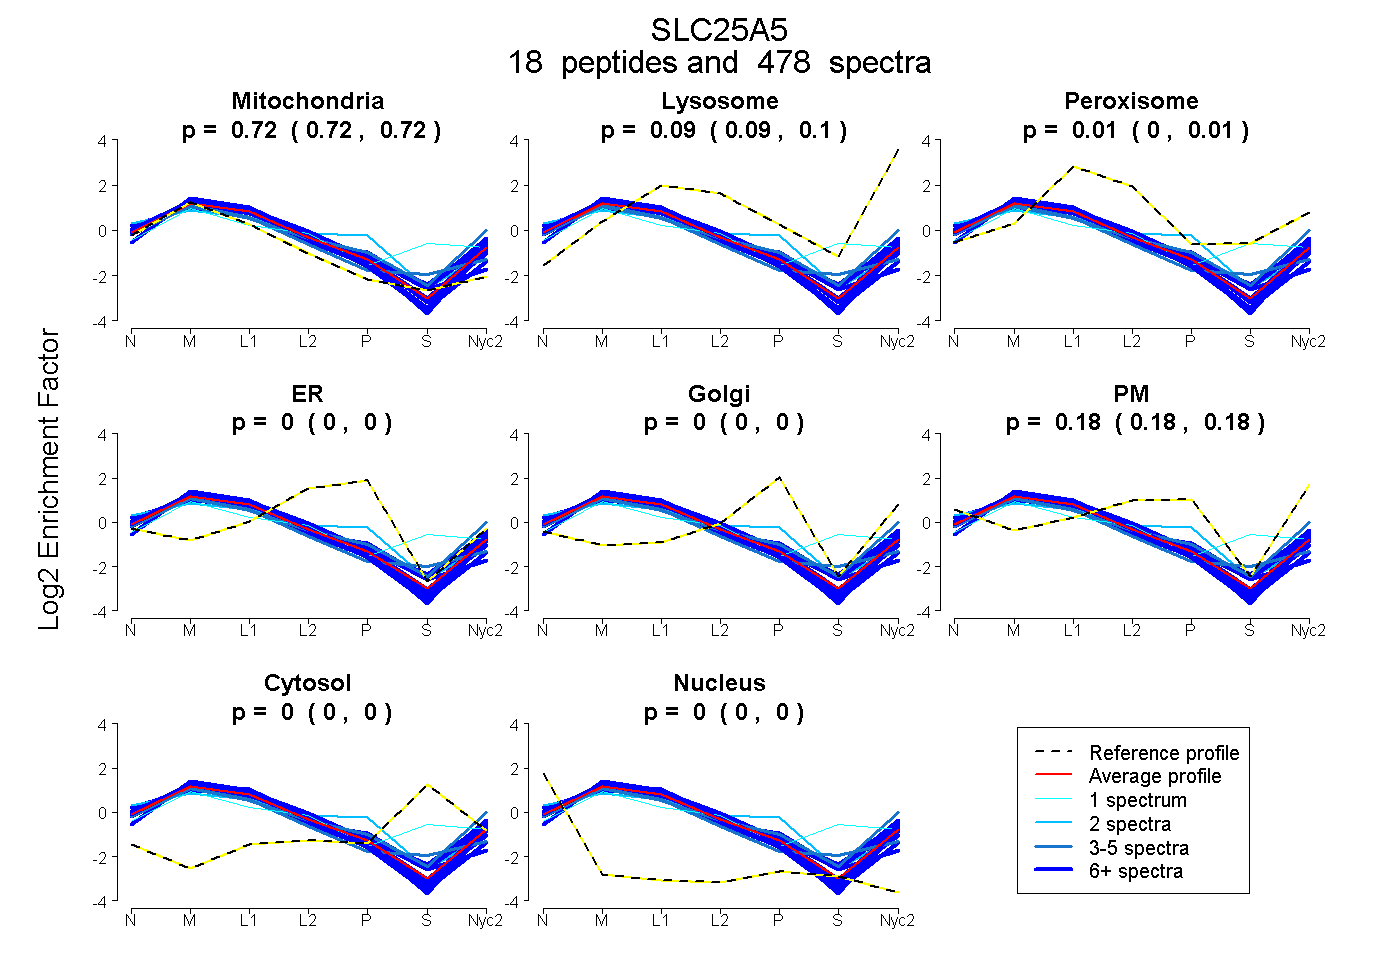
0.717 | 0.719
0.092 | 0.097
0.004 | 0.009
0.000 | 0.000
0.000 | 0.000
0.179 | 0.182
0.000 | 0.000
0.000 | 0.000
16peptides
spectra
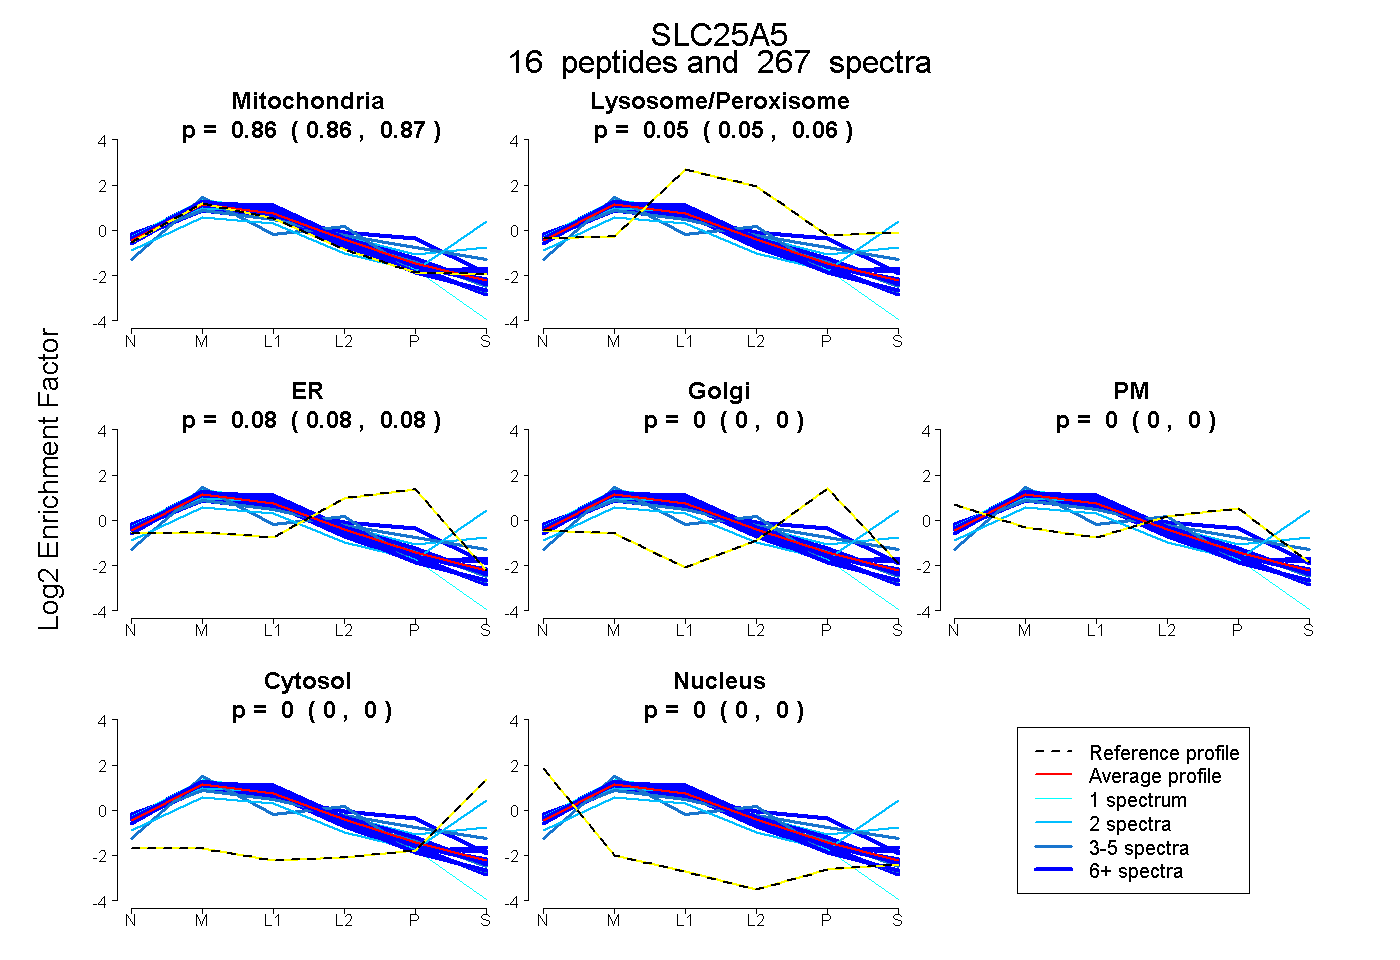
0.861 | 0.866
0.051 | 0.057
0.078 | 0.085
0.000 | 0.000
0.000 | 0.000
0.000 | 0.000
0.000 | 0.000
17peptides
spectra
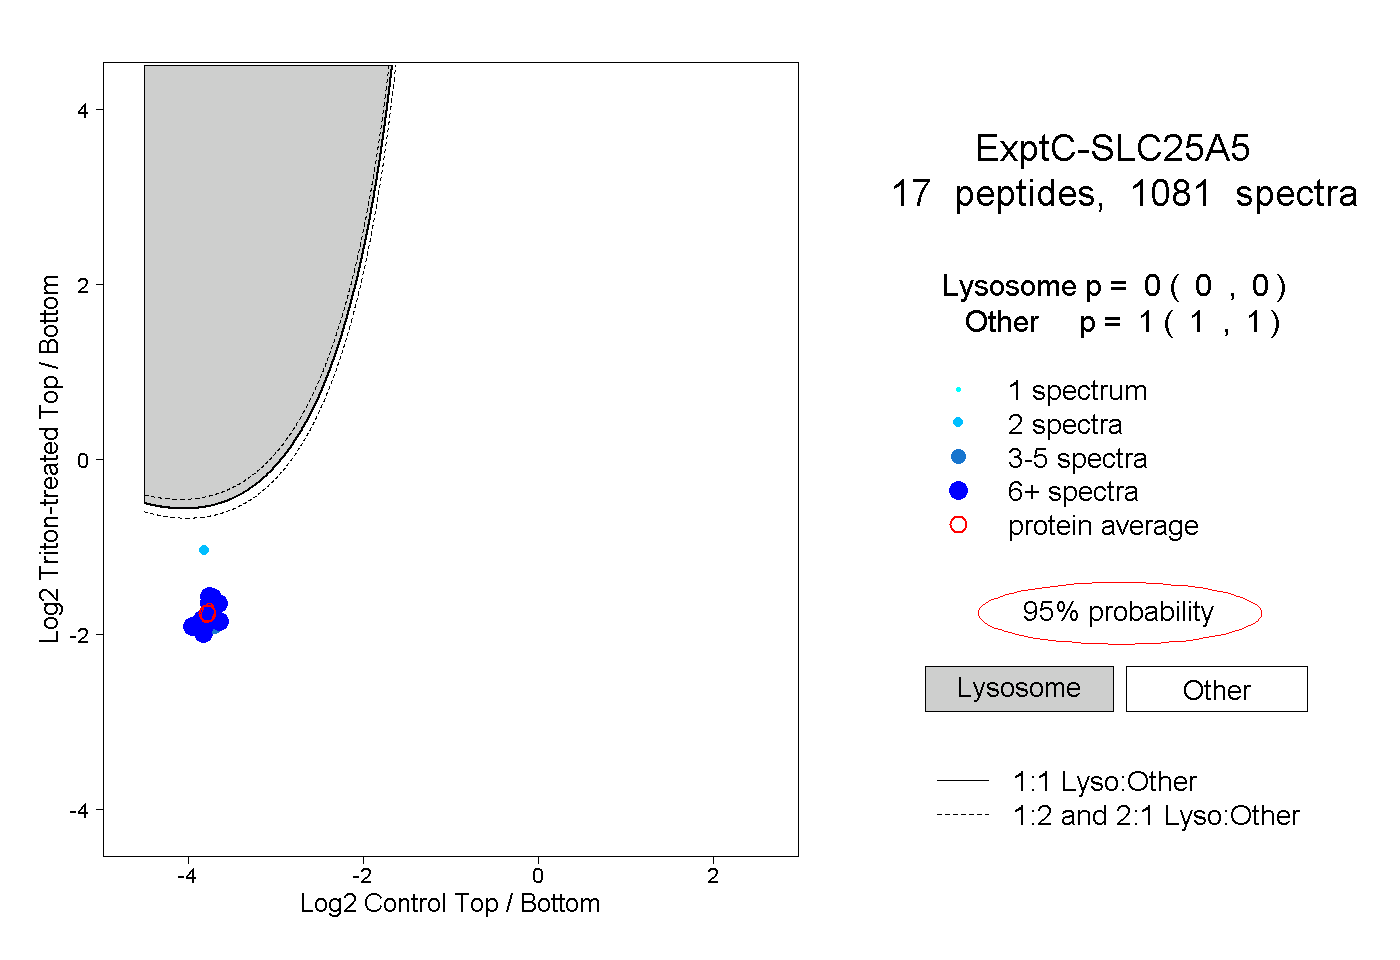
0.000 | 0.000
1.000 | 1.000
10peptides
spectra
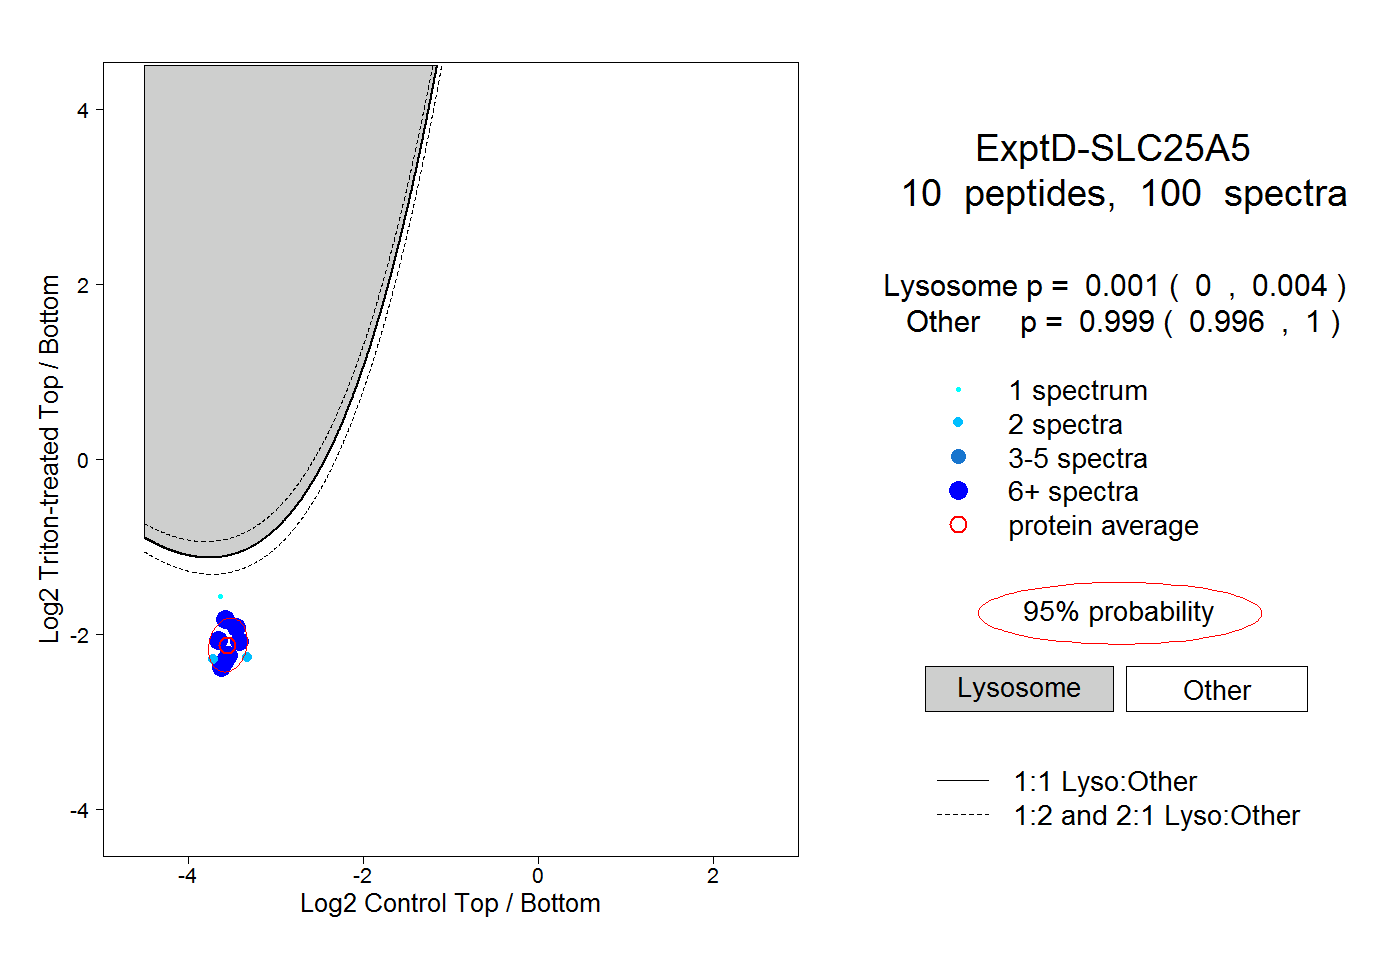
0.000 | 0.004
0.996 | 1.000