 1
1peptide
spectra
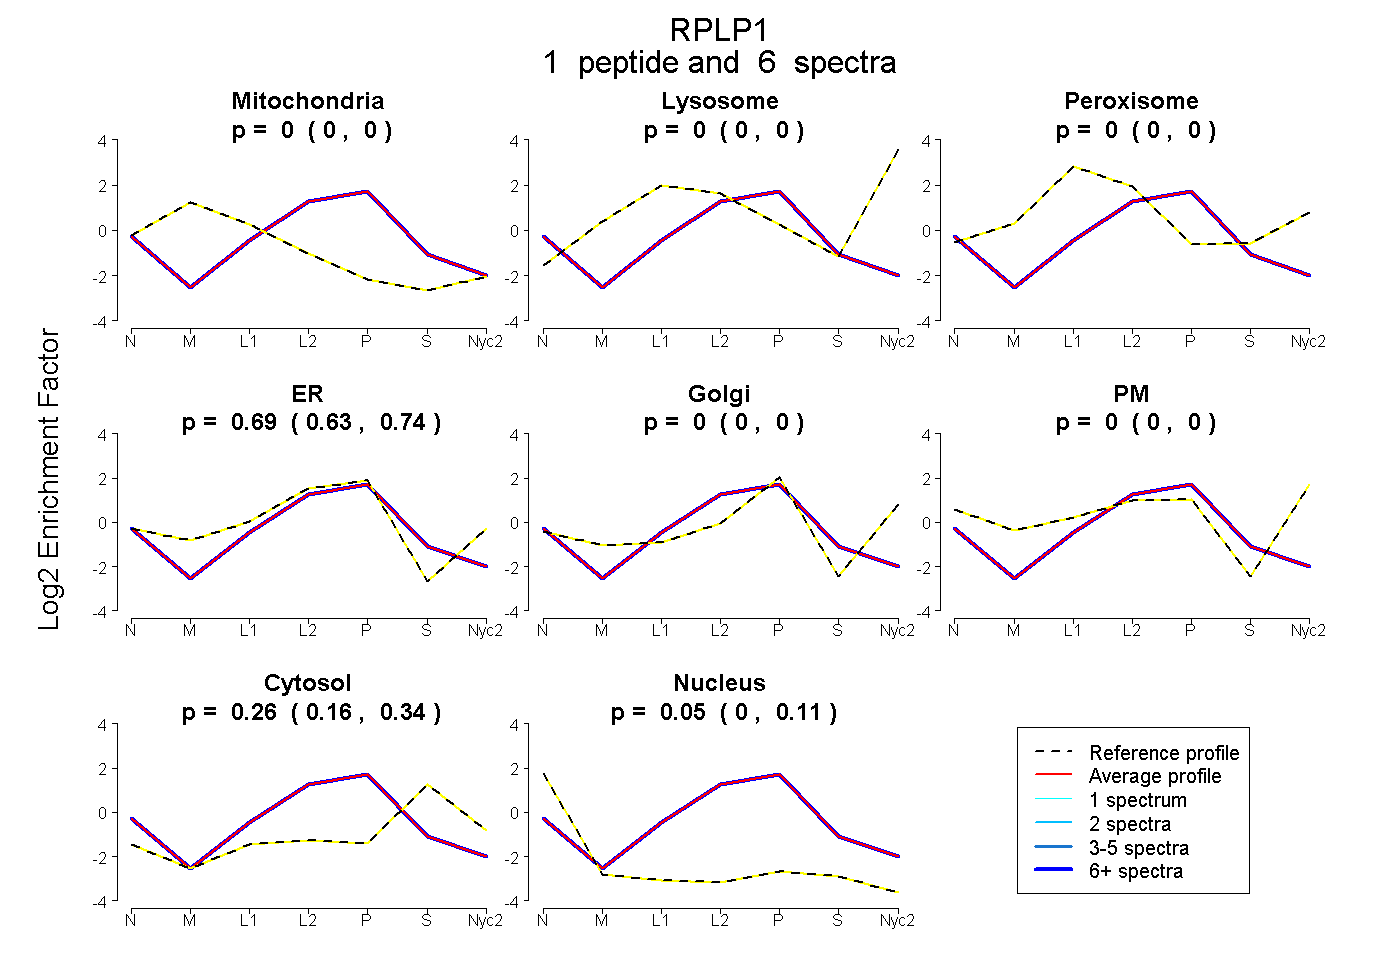
0.000 | 0.000
0.000 | 0.000
0.000 | 0.000
0.626 | 0.744
0.000 | 0.000
0.000 | 0.000
0.165 | 0.339
0.000 | 0.113
1peptide
spectra
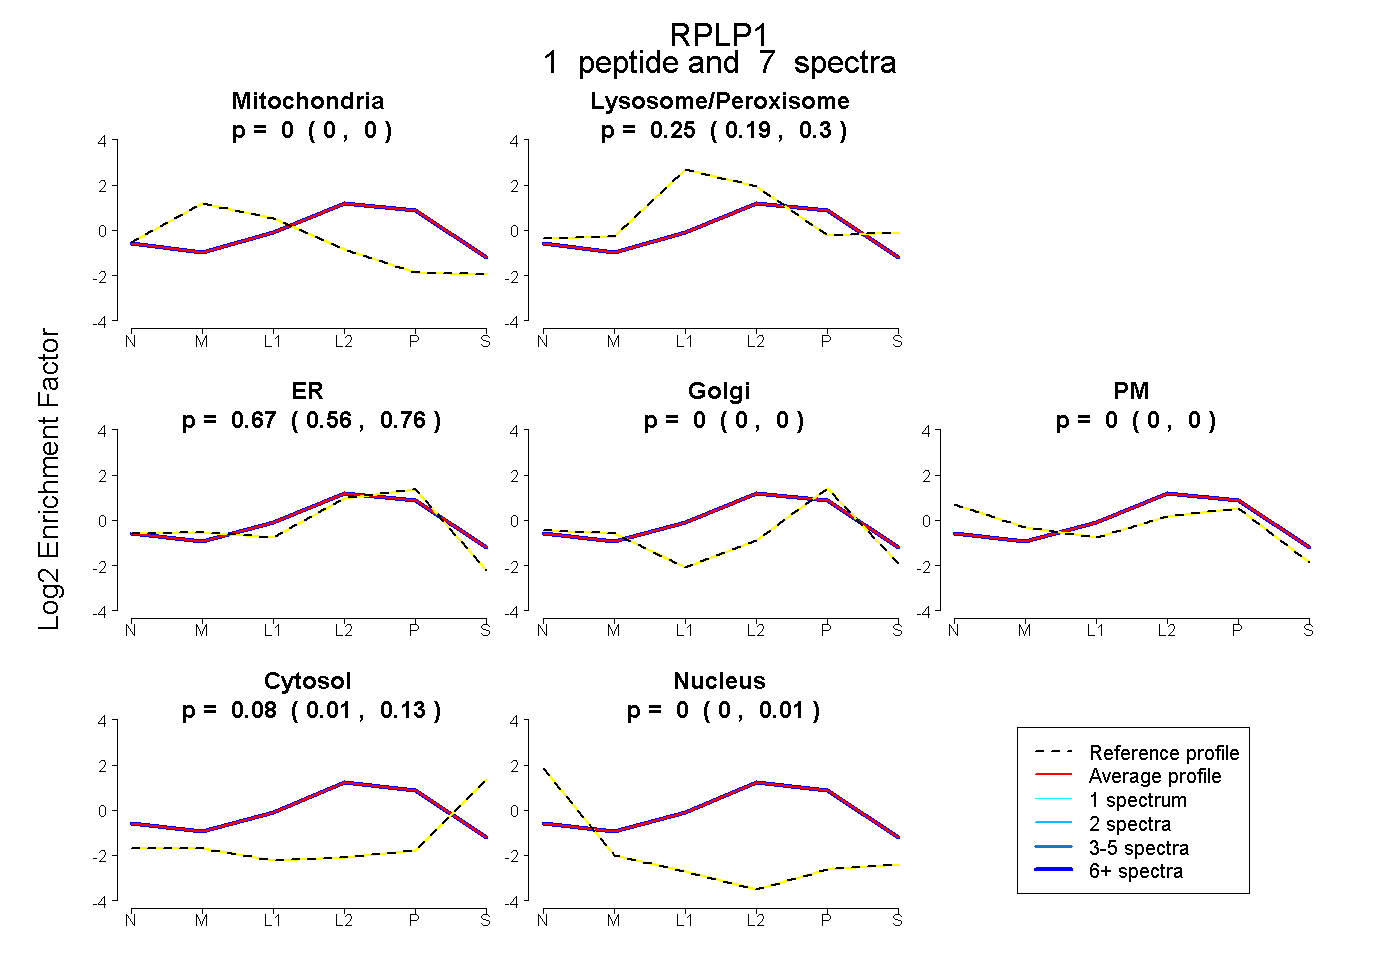
0.000 | 0.000
0.188 | 0.300
0.561 | 0.760
0.000 | 0.000
0.000 | 0.000
0.011 | 0.134
0.000 | 0.012
2peptides
spectra
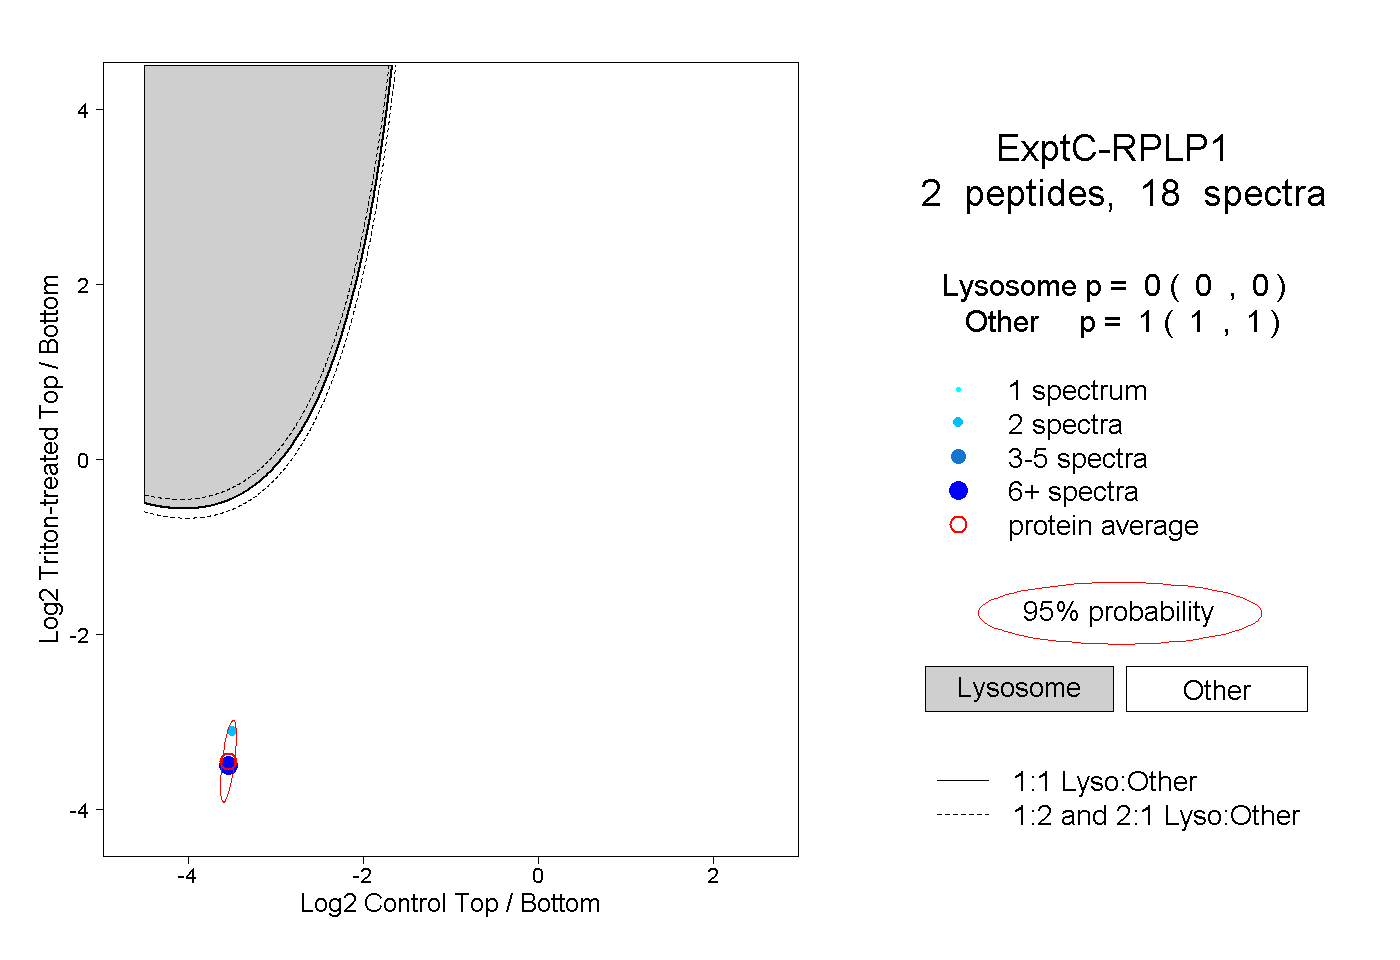
0.000 | 0.000
1.000 | 1.000