 21
21peptides
spectra
0.000 | 0.000
0.000 | 0.000
0.000 | 0.000
0.000 | 0.000
0.000 | 0.000
0.000 | 0.000
0.995 | 0.999
0.000 | 0.005
| Plot | Mito | Lyso | Perox | ER | Golgi | PM | Cytosol | Nucleus | |||||
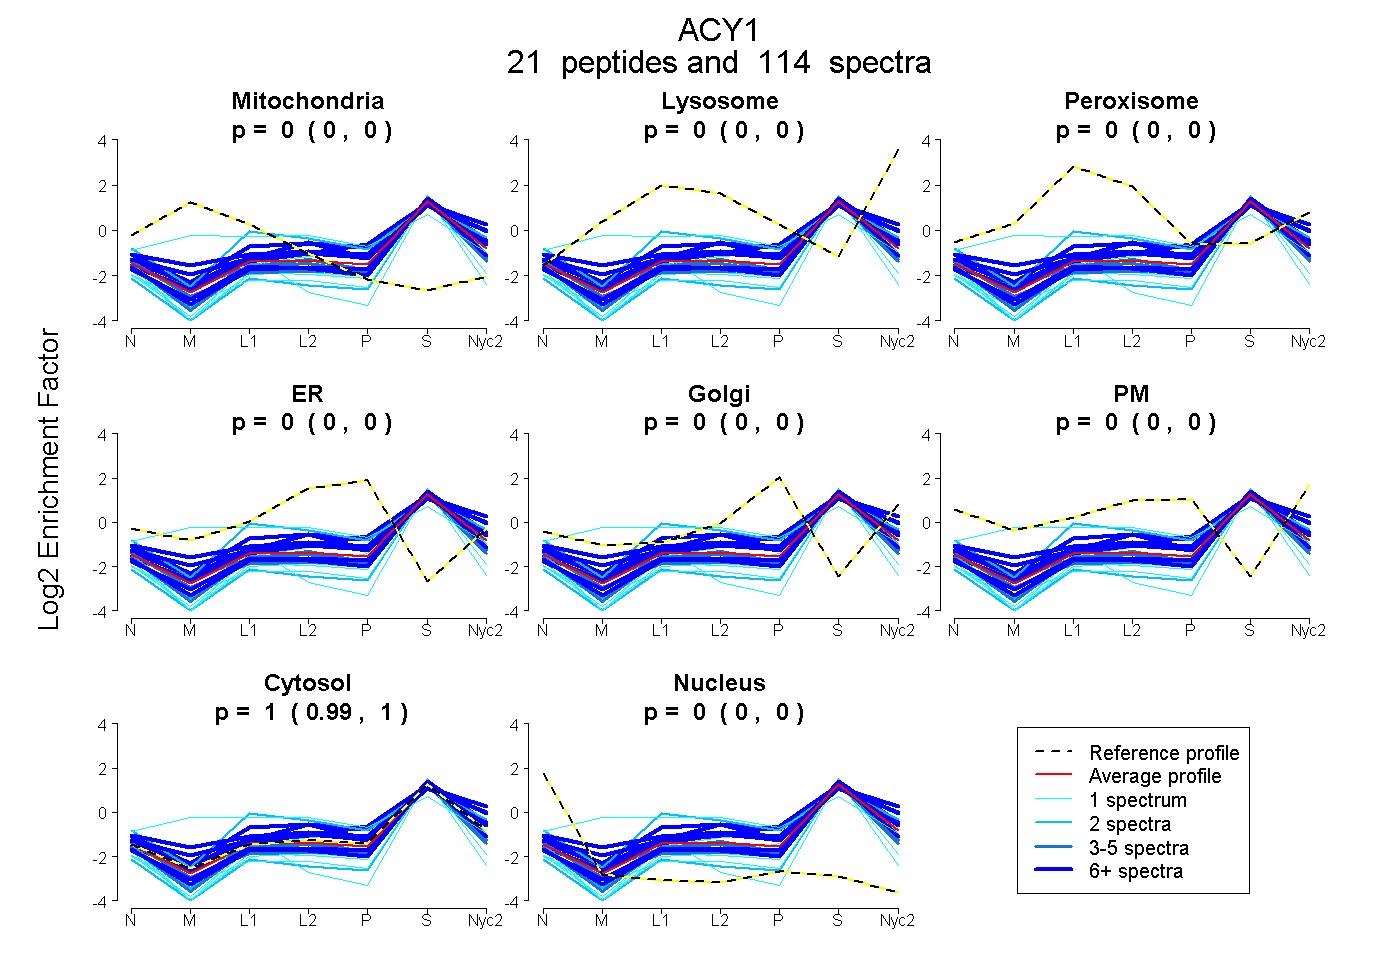
| Expt A |
21 peptides |
114 spectra |
|
0.000 0.000 | 0.000 |
0.000 0.000 | 0.000 |
0.000 0.000 | 0.000 |
0.000 0.000 | 0.000 |
0.000 0.000 | 0.000 |
0.000 0.000 | 0.000 |
0.997 0.995 | 0.999 |
0.003 0.000 | 0.005 |
| 6 spectra, GMELFVK | 0.000 | 0.019 | 0.000 | 0.000 | 0.086 | 0.000 | 0.894 | 0.000 | ||
| 1 spectrum, AVGIPALGFSPMNR | 0.000 | 0.000 | 0.000 | 0.000 | 0.000 | 0.000 | 0.972 | 0.028 | ||
| 15 spectra, GAQDMK | 0.000 | 0.112 | 0.000 | 0.000 | 0.000 | 0.000 | 0.888 | 0.000 | ||
| 1 spectrum, GPESEHPSVTLFR | 0.000 | 0.000 | 0.000 | 0.000 | 0.000 | 0.000 | 0.882 | 0.118 | ||
| 3 spectra, LQANPHLK | 0.000 | 0.000 | 0.000 | 0.000 | 0.000 | 0.000 | 0.927 | 0.073 | ||
| 16 spectra, SPWWIR | 0.000 | 0.000 | 0.000 | 0.000 | 0.000 | 0.000 | 0.970 | 0.030 | ||
| 15 spectra, LHEAVFLR | 0.000 | 0.050 | 0.000 | 0.000 | 0.000 | 0.005 | 0.944 | 0.000 | ||
| 1 spectrum, EGAVTSVNLTK | 0.000 | 0.000 | 0.000 | 0.000 | 0.000 | 0.000 | 0.954 | 0.046 | ||
| 1 spectrum, ICTVQPNPDYGSAVTFLEER | 0.000 | 0.000 | 0.000 | 0.000 | 0.000 | 0.000 | 0.850 | 0.150 | ||
| 1 spectrum, EMNLTLEPEIFPAATDSR | 0.000 | 0.000 | 0.000 | 0.000 | 0.000 | 0.000 | 0.960 | 0.040 | ||
| 9 spectra, RPEFQALR | 0.000 | 0.185 | 0.000 | 0.000 | 0.000 | 0.020 | 0.794 | 0.000 | ||
| 7 spectra, SVSIQYLEAVR | 0.000 | 0.000 | 0.000 | 0.000 | 0.000 | 0.000 | 1.000 | 0.000 | ||
| 4 spectra, FIEDTAAEK | 0.000 | 0.000 | 0.000 | 0.000 | 0.000 | 0.000 | 0.959 | 0.041 | ||
| 1 spectrum, TPVLLHDHNER | 0.174 | 0.000 | 0.267 | 0.029 | 0.000 | 0.000 | 0.531 | 0.000 | ||
| 2 spectra, GVDIYTR | 0.000 | 0.000 | 0.000 | 0.000 | 0.000 | 0.000 | 0.955 | 0.045 | ||
| 11 spectra, VAPDVDMK | 0.000 | 0.014 | 0.094 | 0.025 | 0.000 | 0.000 | 0.867 | 0.000 | ||
| 3 spectra, MTPTDDTDPWWAAFSGACK | 0.000 | 0.000 | 0.000 | 0.000 | 0.000 | 0.000 | 0.960 | 0.040 | ||
| 12 spectra, VVNSILAFR | 0.034 | 0.152 | 0.000 | 0.000 | 0.000 | 0.000 | 0.814 | 0.000 | ||
| 2 spectra, DSEGYIYAR | 0.000 | 0.000 | 0.000 | 0.000 | 0.000 | 0.000 | 0.943 | 0.057 | ||
| 2 spectra, TIHMTFVPDEEVGGHK | 0.000 | 0.000 | 0.247 | 0.003 | 0.000 | 0.005 | 0.745 | 0.000 | ||
| 1 spectrum, EHWHHDPFEAFK | 0.000 | 0.000 | 0.000 | 0.000 | 0.000 | 0.000 | 1.000 | 0.000 |
| Plot | Mito | Lyso or Perox | ER | Golgi | PM | Cytosol | Nucleus | ||||||
| Expt B |
13 peptides |
43 spectra |
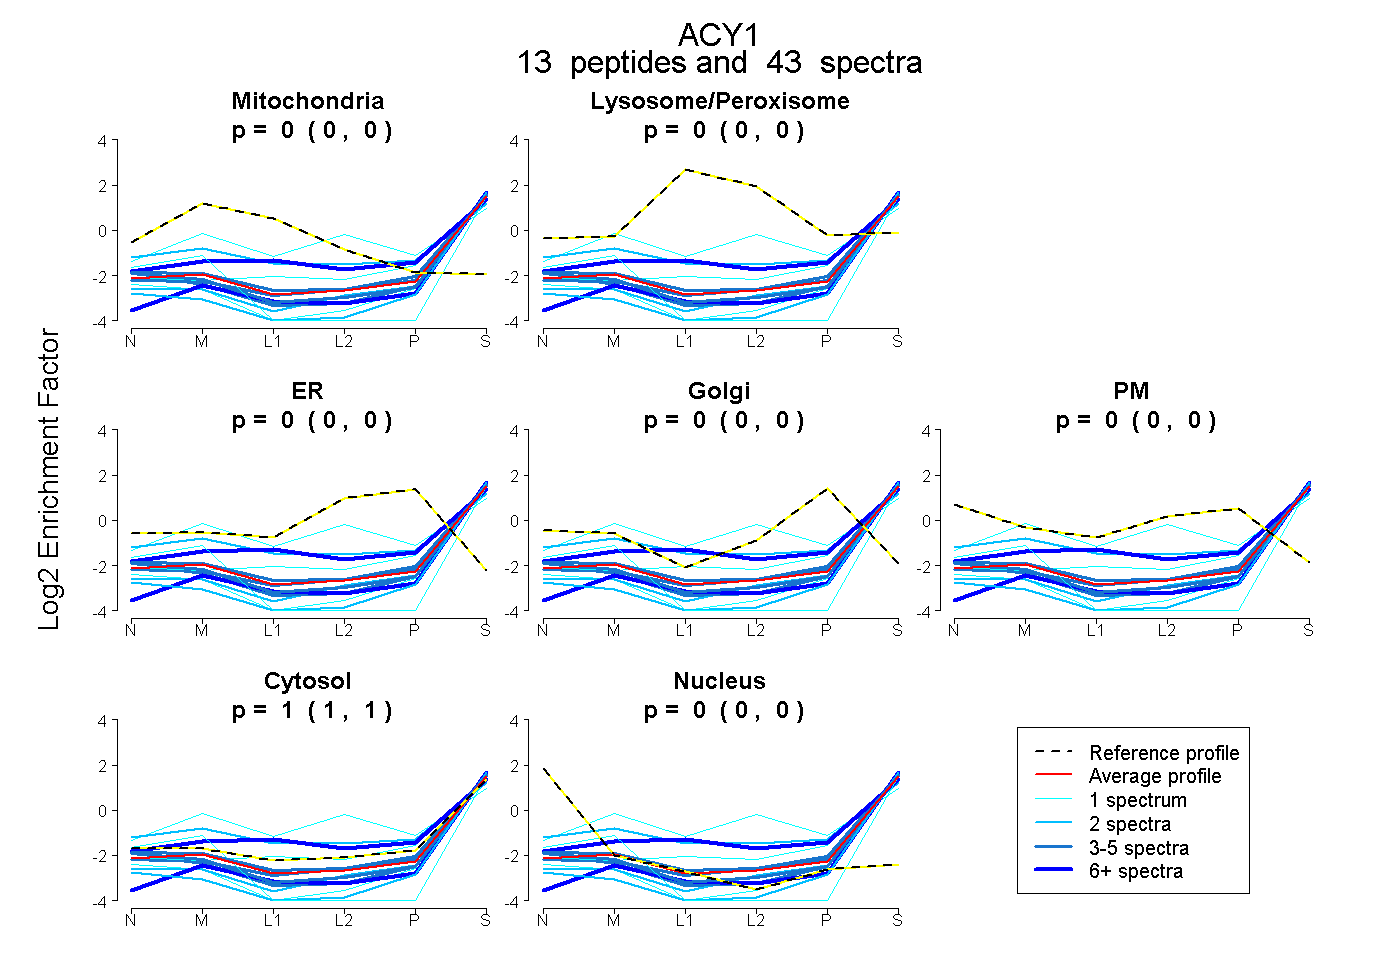 |
0.000 0.000 | 0.000 |
0.000 0.000 | 0.000 |
0.000 0.000 | 0.000 |
0.000 0.000 | 0.000 |
0.000 0.000 | 0.000 |
1.000 1.000 | 1.000 |
0.000 0.000 | 0.000 |
|||
| Plot | Lyso | Other | |||||||||||
| Expt C |
19 peptides |
125 spectra |
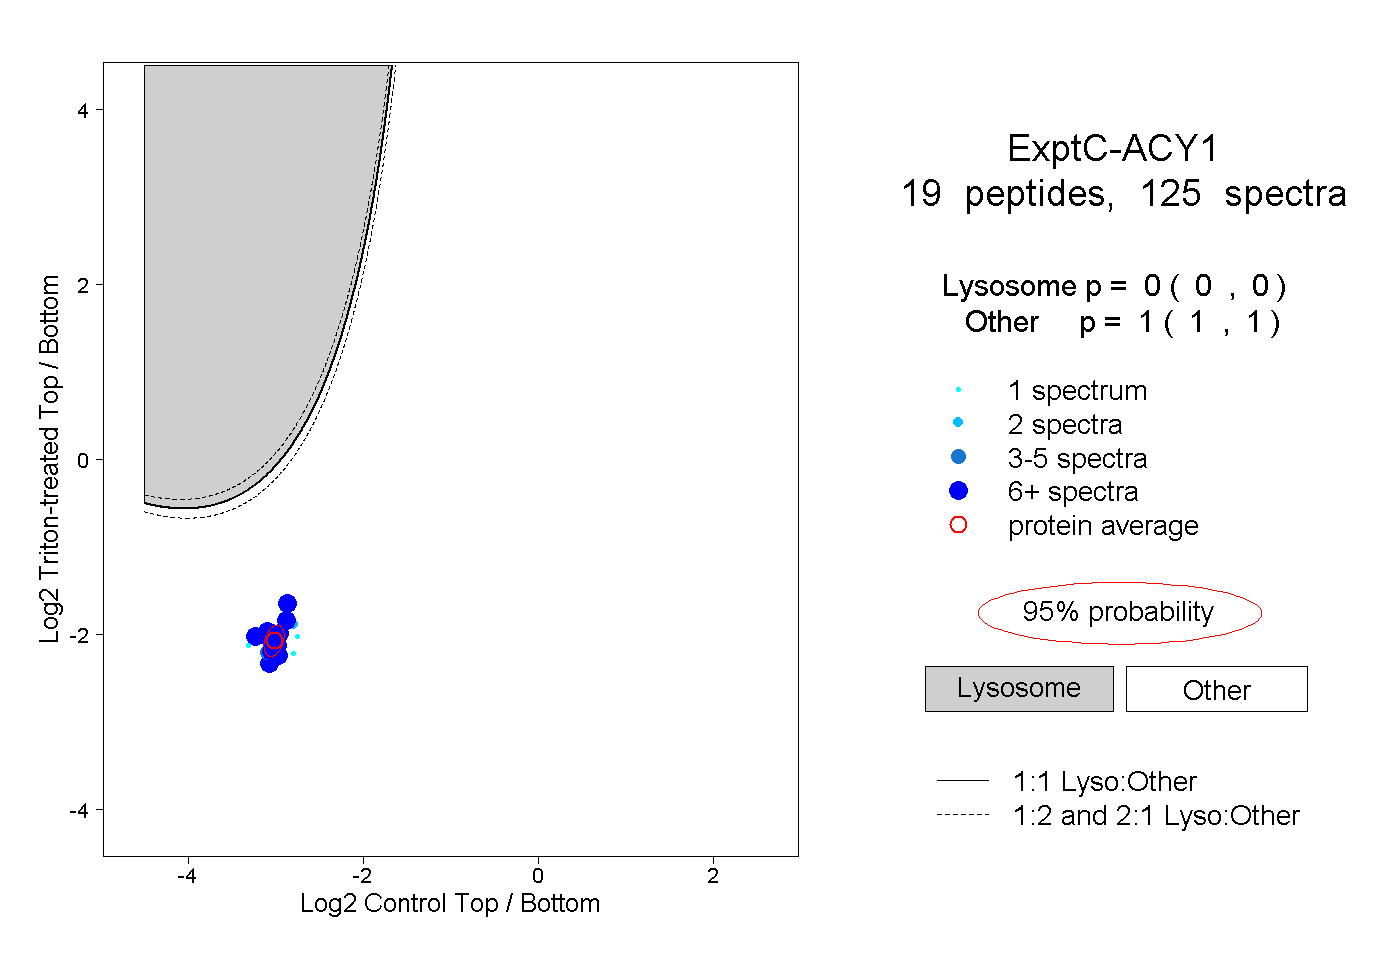 |
0.000 0.000 | 0.000 |
1.000 1.000 | 1.000 |
||||||||
| Plot | Lyso | Other | |||||||||||
| Expt D |
4 peptides |
5 spectra |
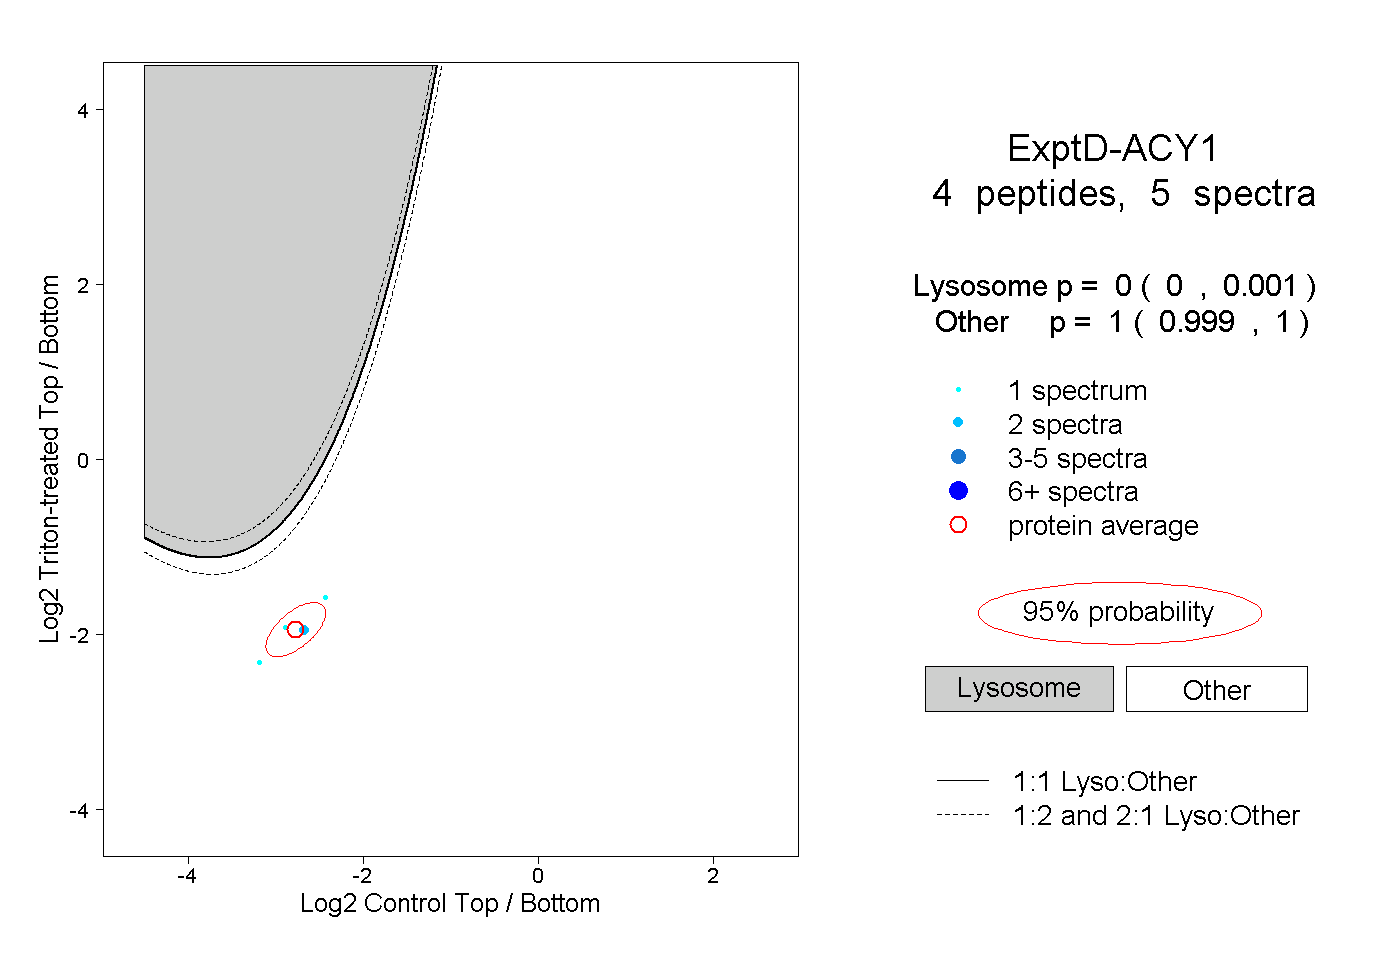 |
0.000 0.000 | 0.001 |
1.000 0.999 | 1.000 |