 8
8peptides
spectra
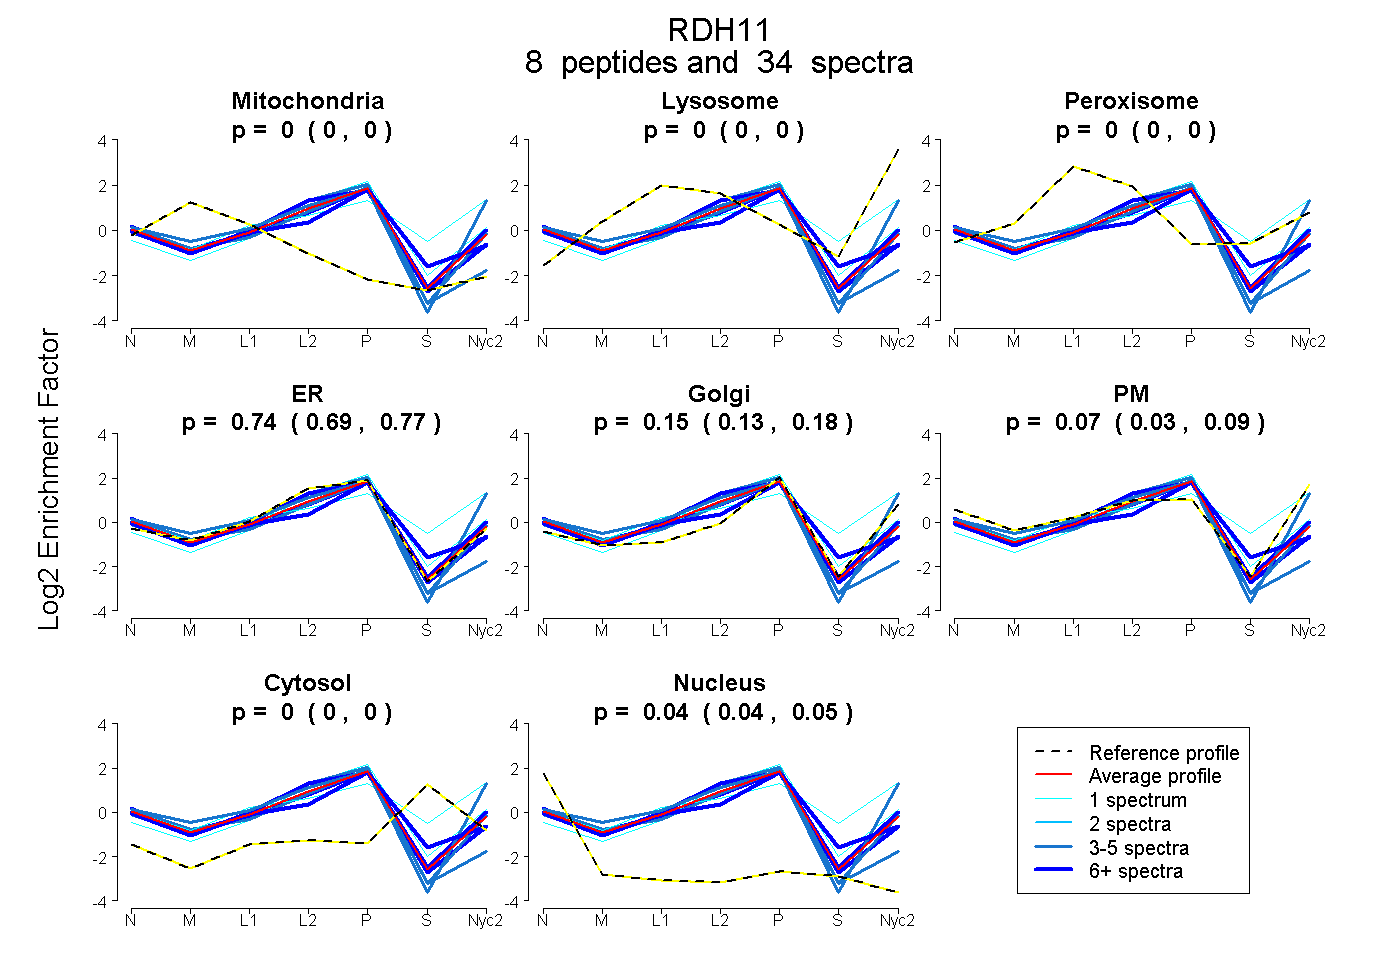
0.000 | 0.000
0.000 | 0.000
0.000 | 0.004
0.689 | 0.772
0.129 | 0.177
0.034 | 0.093
0.000 | 0.000
0.035 | 0.049
| Plot | Mito | Lyso | Perox | ER | Golgi | PM | Cytosol | Nucleus | |||||
| Expt A |
8 peptides |
34 spectra |
|
0.000 0.000 | 0.000 |
0.000 0.000 | 0.000 |
0.000 0.000 | 0.004 |
0.735 0.689 | 0.772 |
0.155 0.129 | 0.177 |
0.067 0.034 | 0.093 |
0.000 0.000 | 0.000 |
0.043 0.035 | 0.049 |
| 1 spectrum, ESGPSR | 0.000 | 0.000 | 0.000 | 0.689 | 0.253 | 0.000 | 0.058 | 0.000 | ||
| 4 spectra, VVNVSSLAHHLGR | 0.000 | 0.000 | 0.000 | 0.316 | 0.097 | 0.587 | 0.000 | 0.000 | ||
| 6 spectra, VYIACR | 0.000 | 0.000 | 0.000 | 0.662 | 0.150 | 0.000 | 0.159 | 0.029 | ||
| 1 spectrum, VTTYSVHPGTVHSELIR | 0.000 | 0.140 | 0.107 | 0.000 | 0.247 | 0.327 | 0.179 | 0.000 | ||
| 3 spectra, VAIVTGANTGIGK | 0.000 | 0.000 | 0.000 | 0.684 | 0.217 | 0.051 | 0.000 | 0.048 | ||
| 7 spectra, LANILFTK | 0.000 | 0.000 | 0.000 | 0.769 | 0.027 | 0.173 | 0.000 | 0.030 | ||
| 9 spectra, AFAEGFLAEEK | 0.002 | 0.000 | 0.000 | 0.822 | 0.100 | 0.000 | 0.000 | 0.077 | ||
| 3 spectra, FYSGGLAYCHSK | 0.000 | 0.000 | 0.000 | 0.906 | 0.000 | 0.000 | 0.000 | 0.094 |
| Plot | Mito | Lyso or Perox | ER | Golgi | PM | Cytosol | Nucleus | ||||||
| Expt B |
6 peptides |
22 spectra |
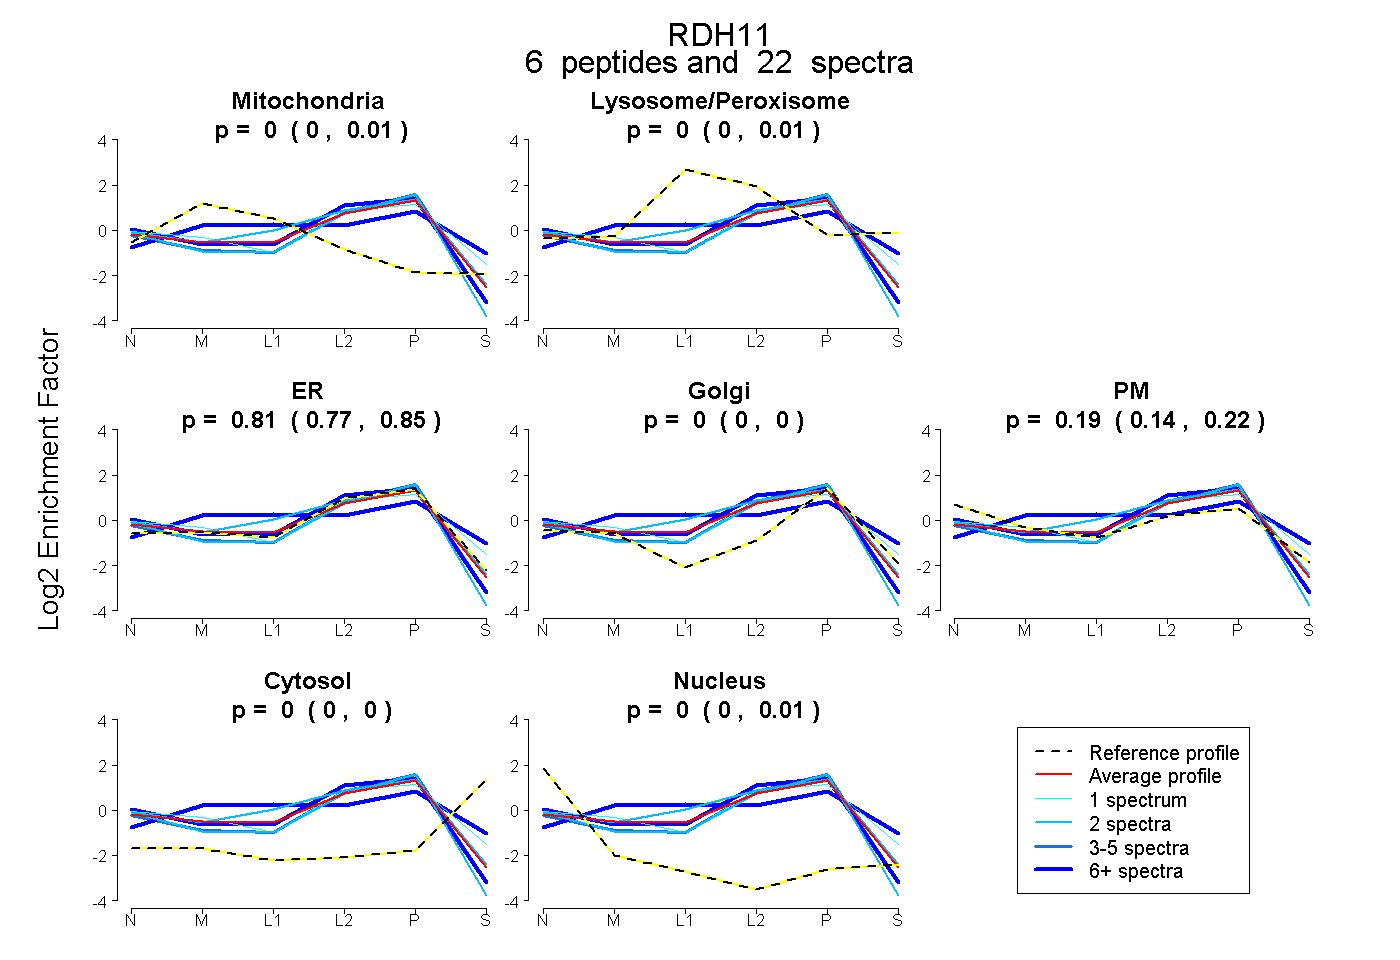 |
0.000 0.000 | 0.008 |
0.000 0.000 | 0.009 |
0.808 0.773 | 0.845 |
0.000 0.000 | 0.000 |
0.192 0.137 | 0.217 |
0.000 0.000 | 0.000 |
0.000 0.000 | 0.007 |
|||
| Plot | Lyso | Other | |||||||||||
| Expt C |
9 peptides |
34 spectra |
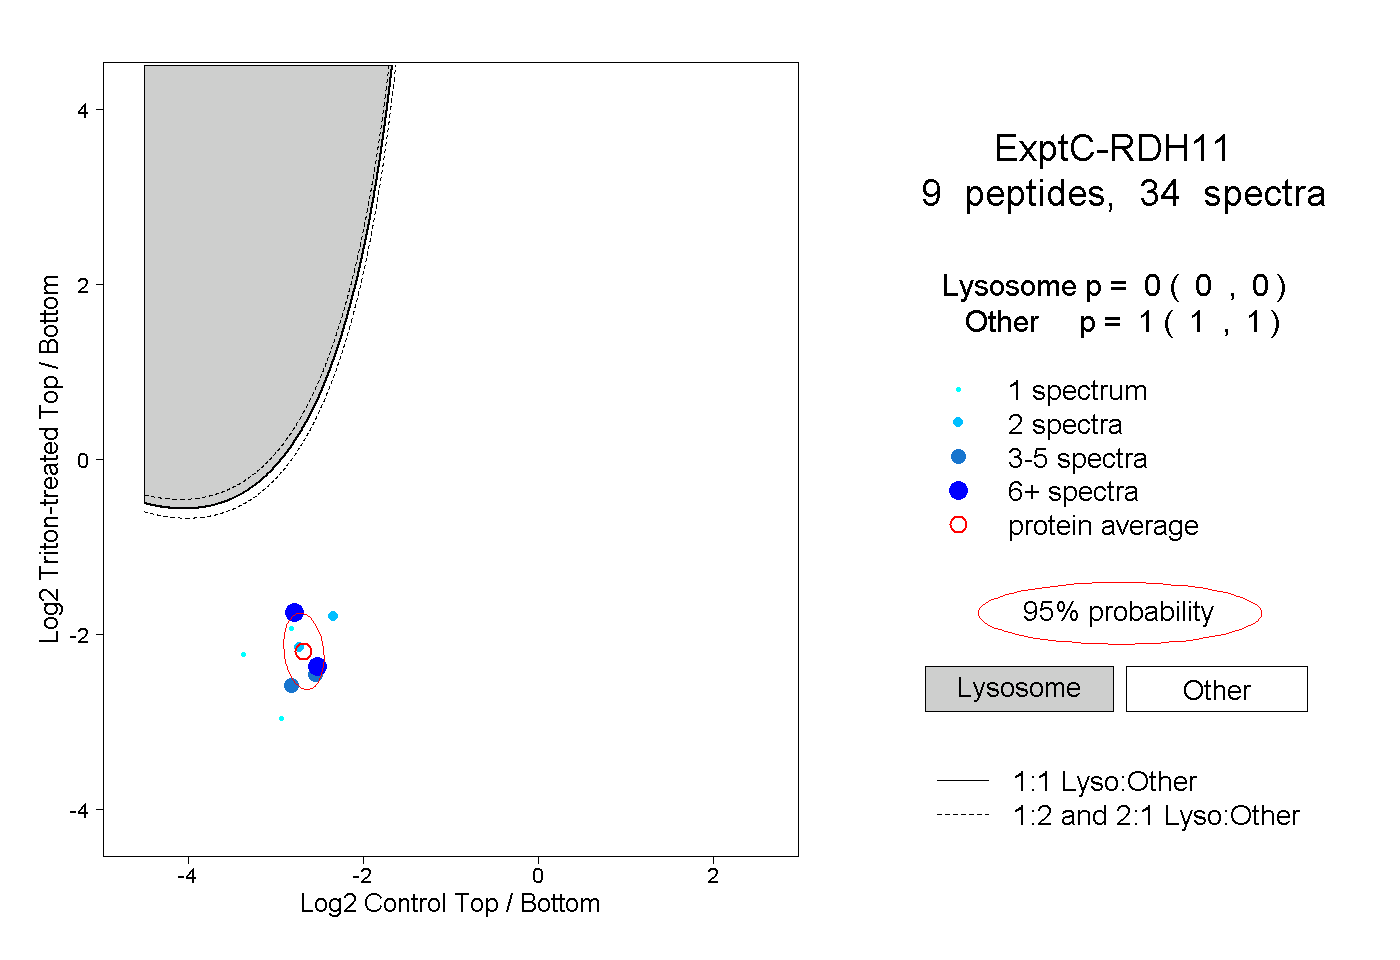 |
0.000 0.000 | 0.000 |
1.000 1.000 | 1.000 |
||||||||
| Plot | Lyso | Other | |||||||||||
| Expt D |
1 peptide |
2 spectra |
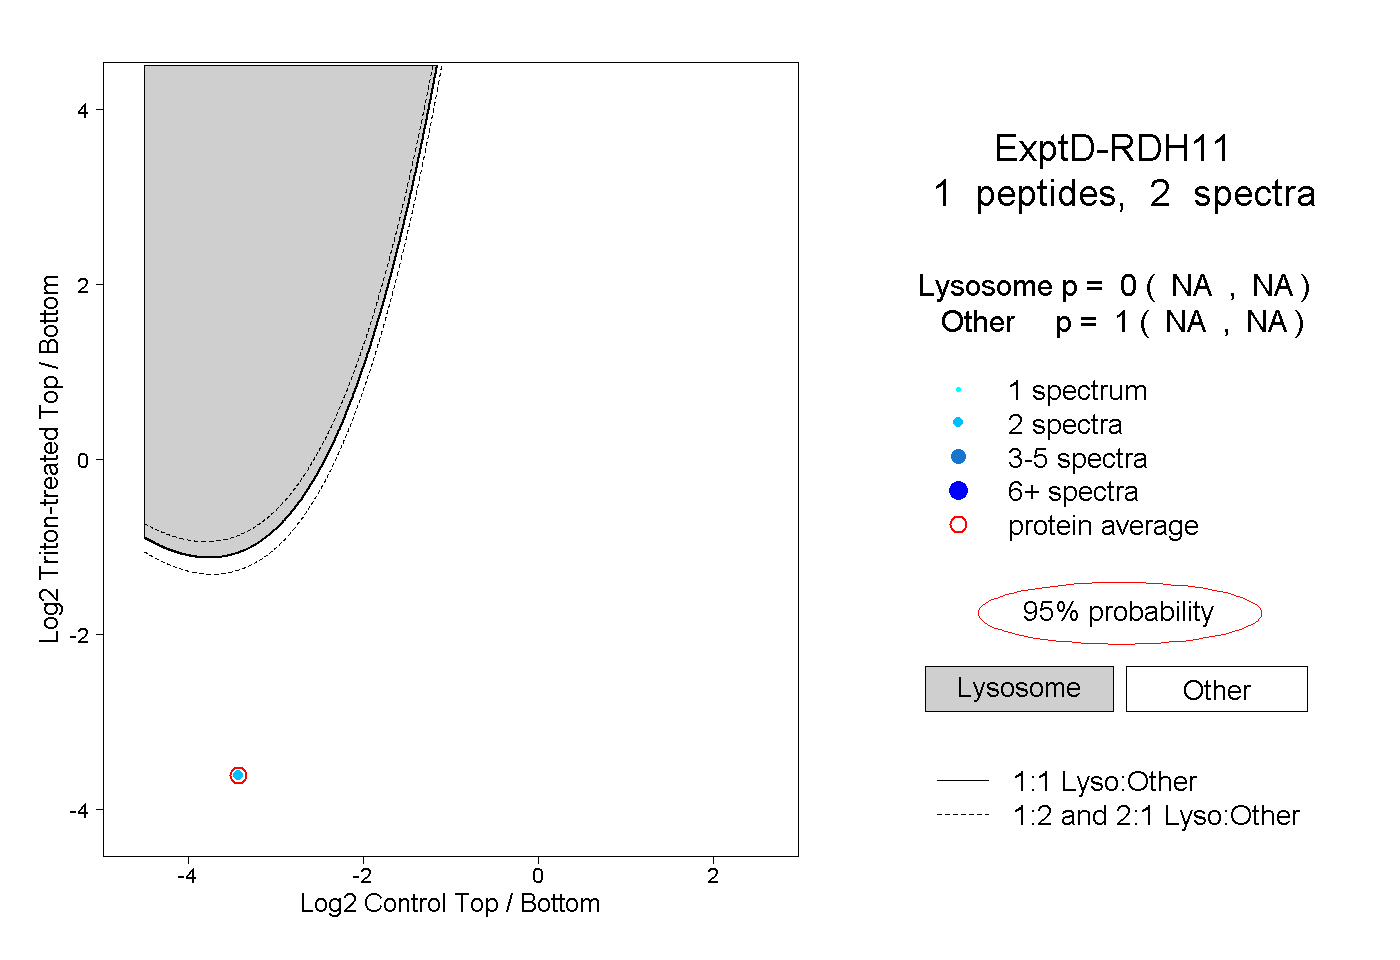 |
0.000 NA | NA |
1.000 NA | NA |