10
10peptides
spectra
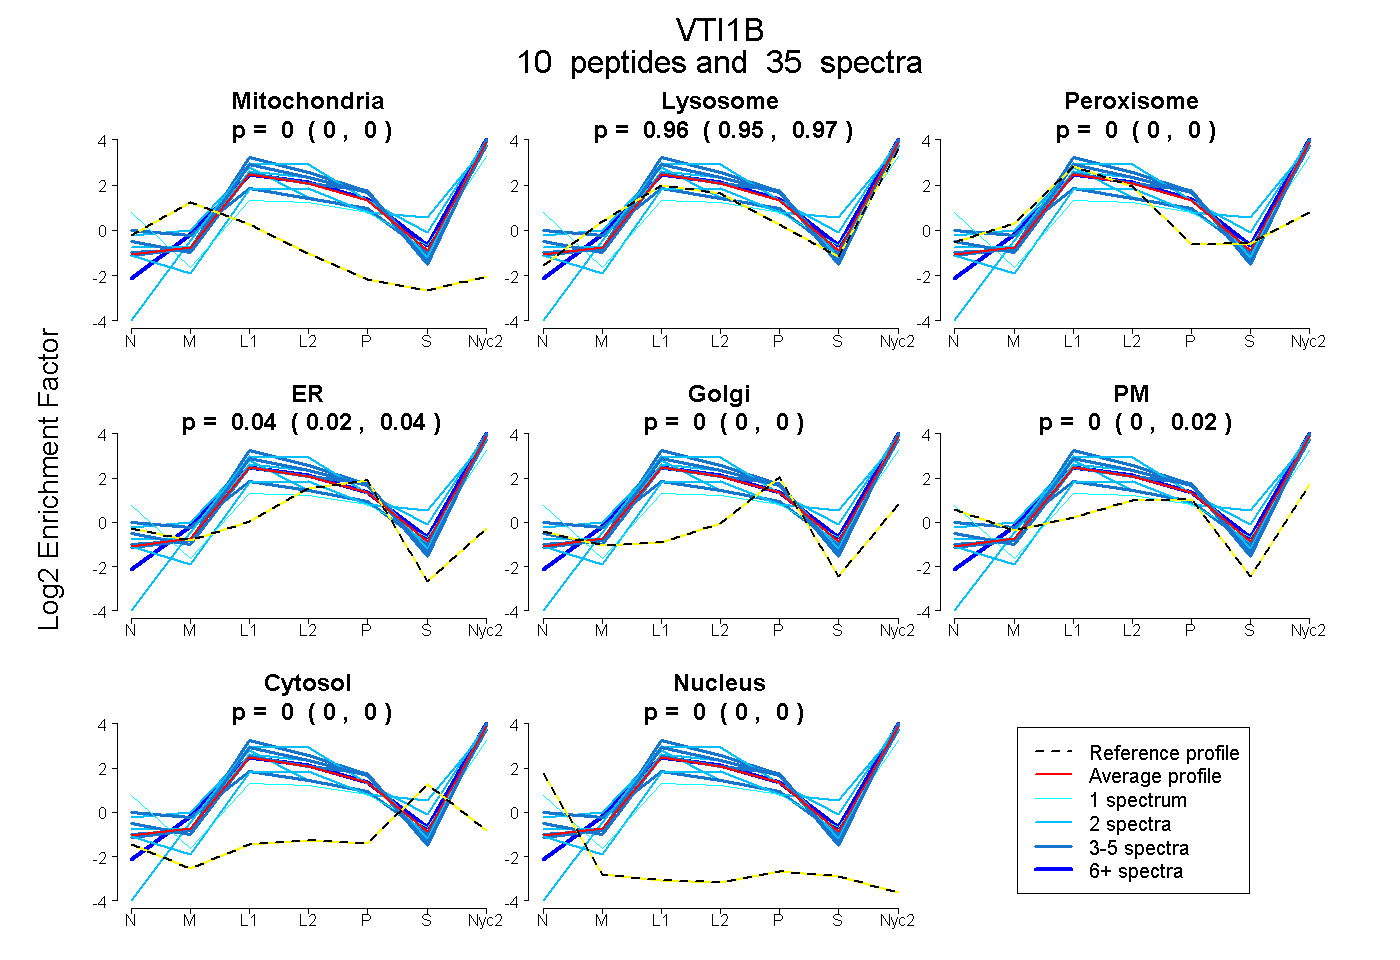
0.000 | 0.000
0.946 | 0.971
0.000 | 0.000
0.023 | 0.043
0.000 | 0.000
0.000 | 0.020
0.000 | 0.000
0.000 | 0.000
8peptides
spectra
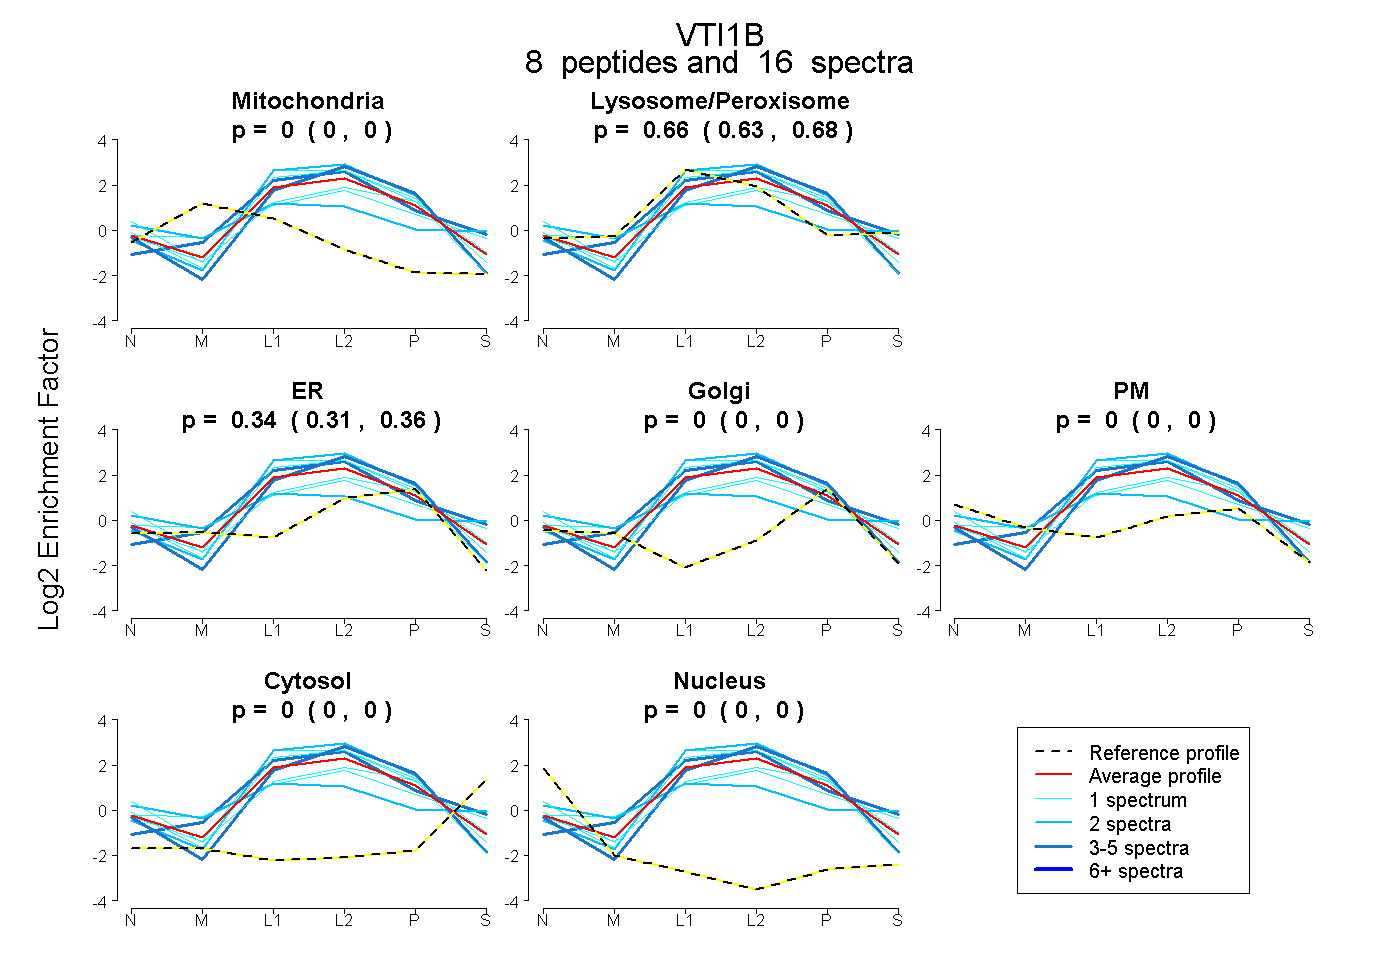
0.000 | 0.000
0.634 | 0.682
0.314 | 0.361
0.000 | 0.000
0.000 | 0.000
0.000 | 0.000
0.000 | 0.000