 10
10peptides
spectra
0.000 | 0.000
0.946 | 0.971
0.000 | 0.000
0.023 | 0.043
0.000 | 0.000
0.000 | 0.020
0.000 | 0.000
0.000 | 0.000
| Plot | Mito | Lyso | Perox | ER | Golgi | PM | Cytosol | Nucleus | |||||
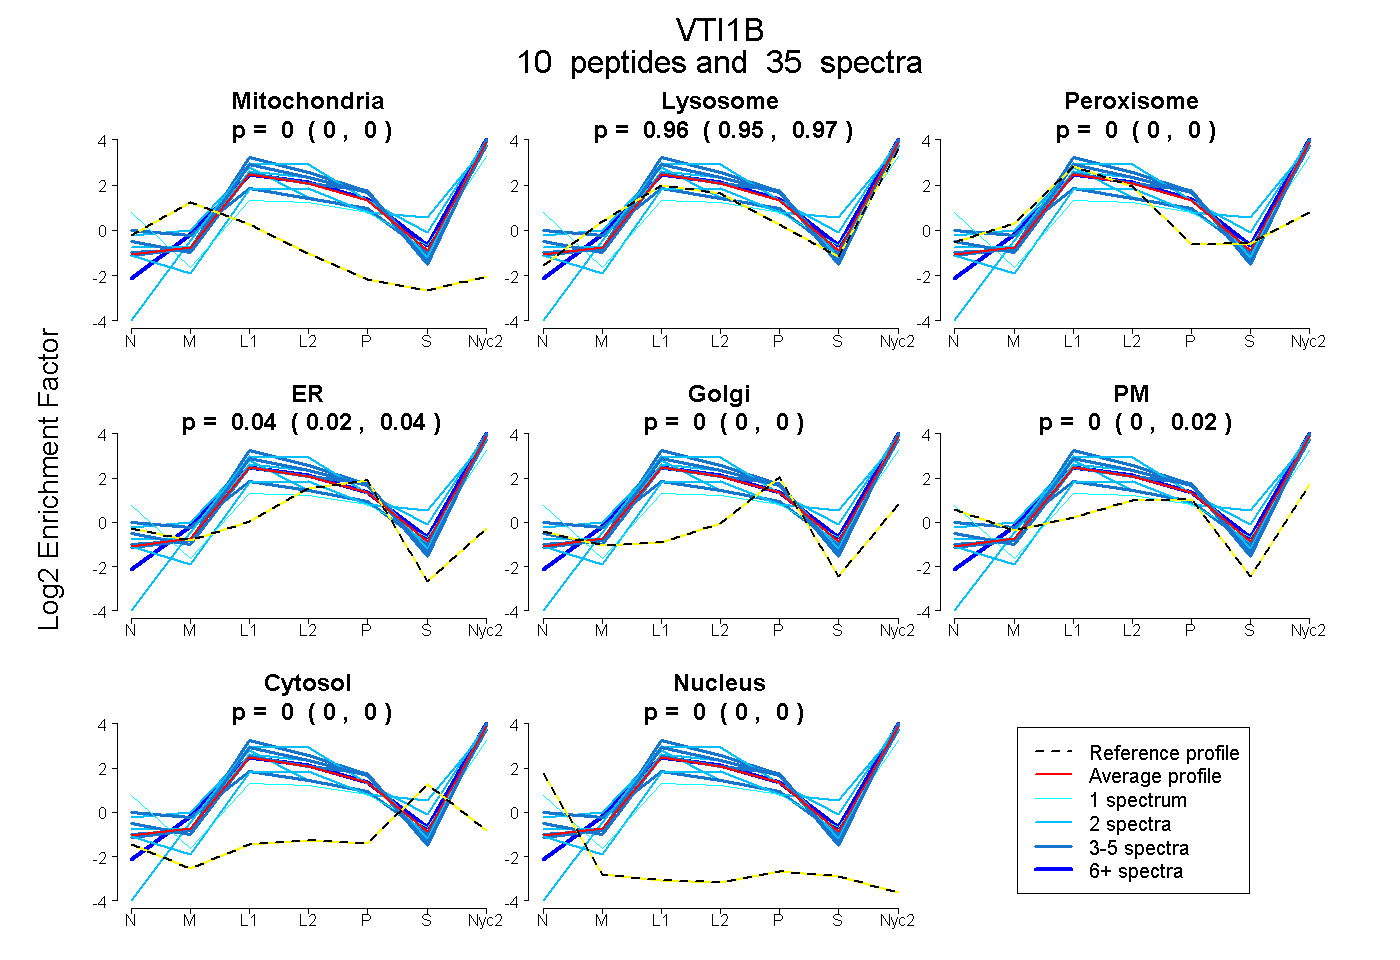
| Expt A |
10 peptides |
35 spectra |
|
0.000 0.000 | 0.000 |
0.963 0.946 | 0.971 |
0.000 0.000 | 0.000 |
0.037 0.023 | 0.043 |
0.000 0.000 | 0.000 |
0.000 0.000 | 0.020 |
0.000 0.000 | 0.000 |
0.000 0.000 | 0.000 |
| 4 spectra, GLLEDLQGVPER | 0.000 | 0.989 | 0.000 | 0.011 | 0.000 | 0.000 | 0.000 | 0.000 | ||
| 11 spectra, ATQSIER | 0.000 | 1.000 | 0.000 | 0.000 | 0.000 | 0.000 | 0.000 | 0.000 | ||
| 1 spectrum, NSMMSK | 0.000 | 0.427 | 0.000 | 0.000 | 0.000 | 0.499 | 0.074 | 0.000 | ||
| 3 spectra, STPLTATPGGR | 0.000 | 0.801 | 0.000 | 0.000 | 0.000 | 0.199 | 0.000 | 0.000 | ||
| 2 spectra, LLGTAGTEEK | 0.000 | 0.914 | 0.000 | 0.036 | 0.000 | 0.050 | 0.000 | 0.000 | ||
| 2 spectra, ATSAASSEHFEK | 0.000 | 0.906 | 0.011 | 0.000 | 0.000 | 0.083 | 0.000 | 0.000 | ||
| 4 spectra, FGTYTLENEHLNR | 0.000 | 0.711 | 0.000 | 0.000 | 0.000 | 0.289 | 0.000 | 0.000 | ||
| 2 spectra, LVNTNENLSK | 0.000 | 1.000 | 0.000 | 0.000 | 0.000 | 0.000 | 0.000 | 0.000 | ||
| 4 spectra, YAPLTFR | 0.000 | 0.943 | 0.000 | 0.057 | 0.000 | 0.000 | 0.000 | 0.000 | ||
| 2 spectra, LHEIFR | 0.000 | 0.836 | 0.000 | 0.000 | 0.000 | 0.000 | 0.164 | 0.000 |
| Plot | Mito | Lyso or Perox | ER | Golgi | PM | Cytosol | Nucleus | ||||||
| Expt B |
8 peptides |
16 spectra |
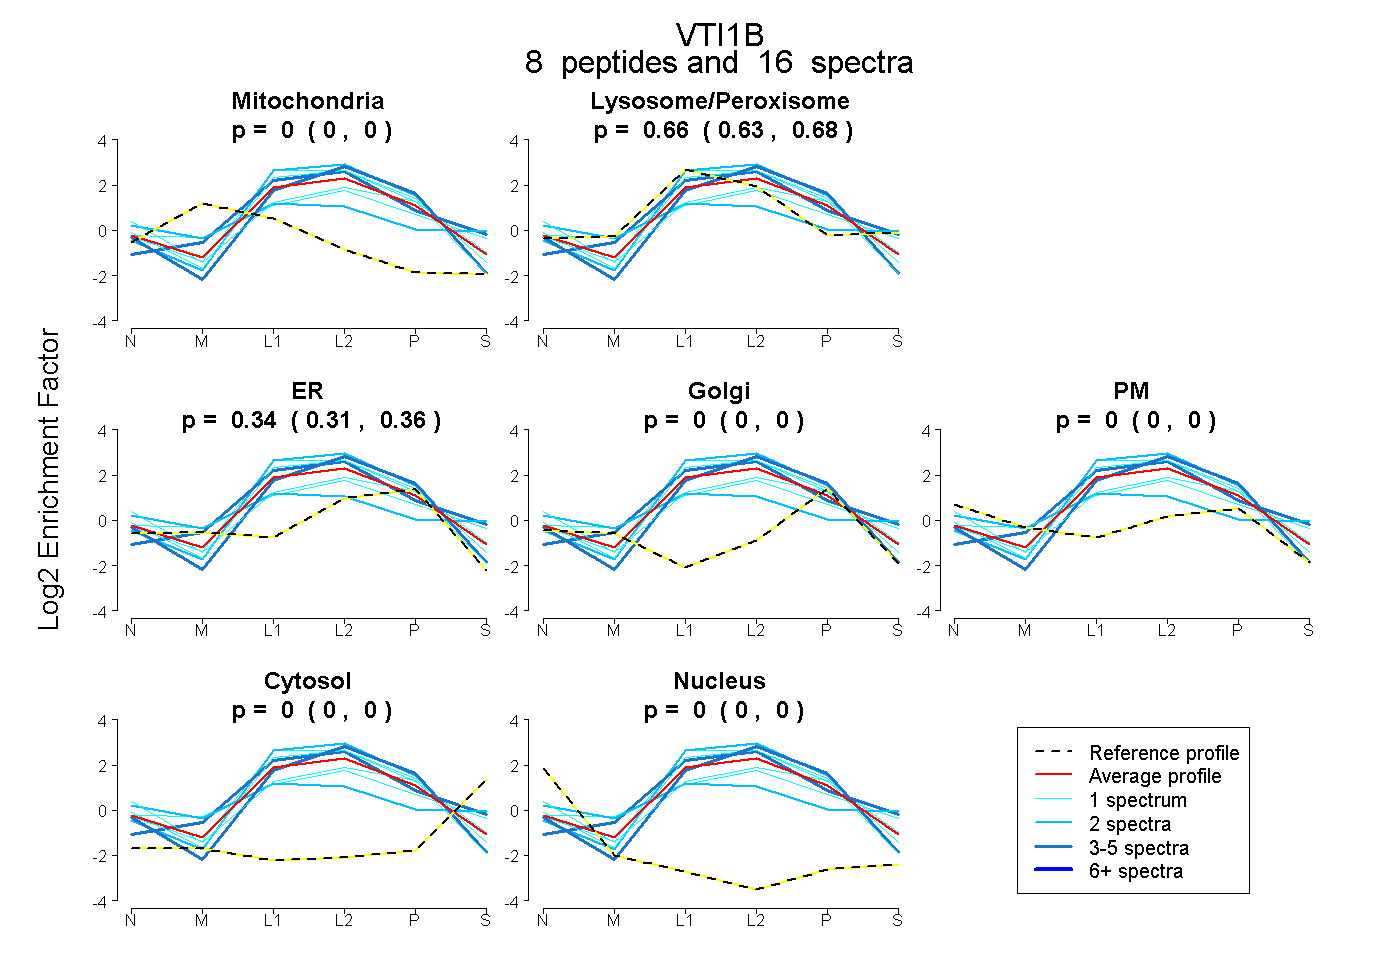 |
0.000 0.000 | 0.000 |
0.660 0.634 | 0.682 |
0.340 0.314 | 0.361 |
0.000 0.000 | 0.000 |
0.000 0.000 | 0.000 |
0.000 0.000 | 0.000 |
0.000 0.000 | 0.000 |
|||
| Plot | Lyso | Other | |||||||||||
| Expt C |
11 peptides |
58 spectra |
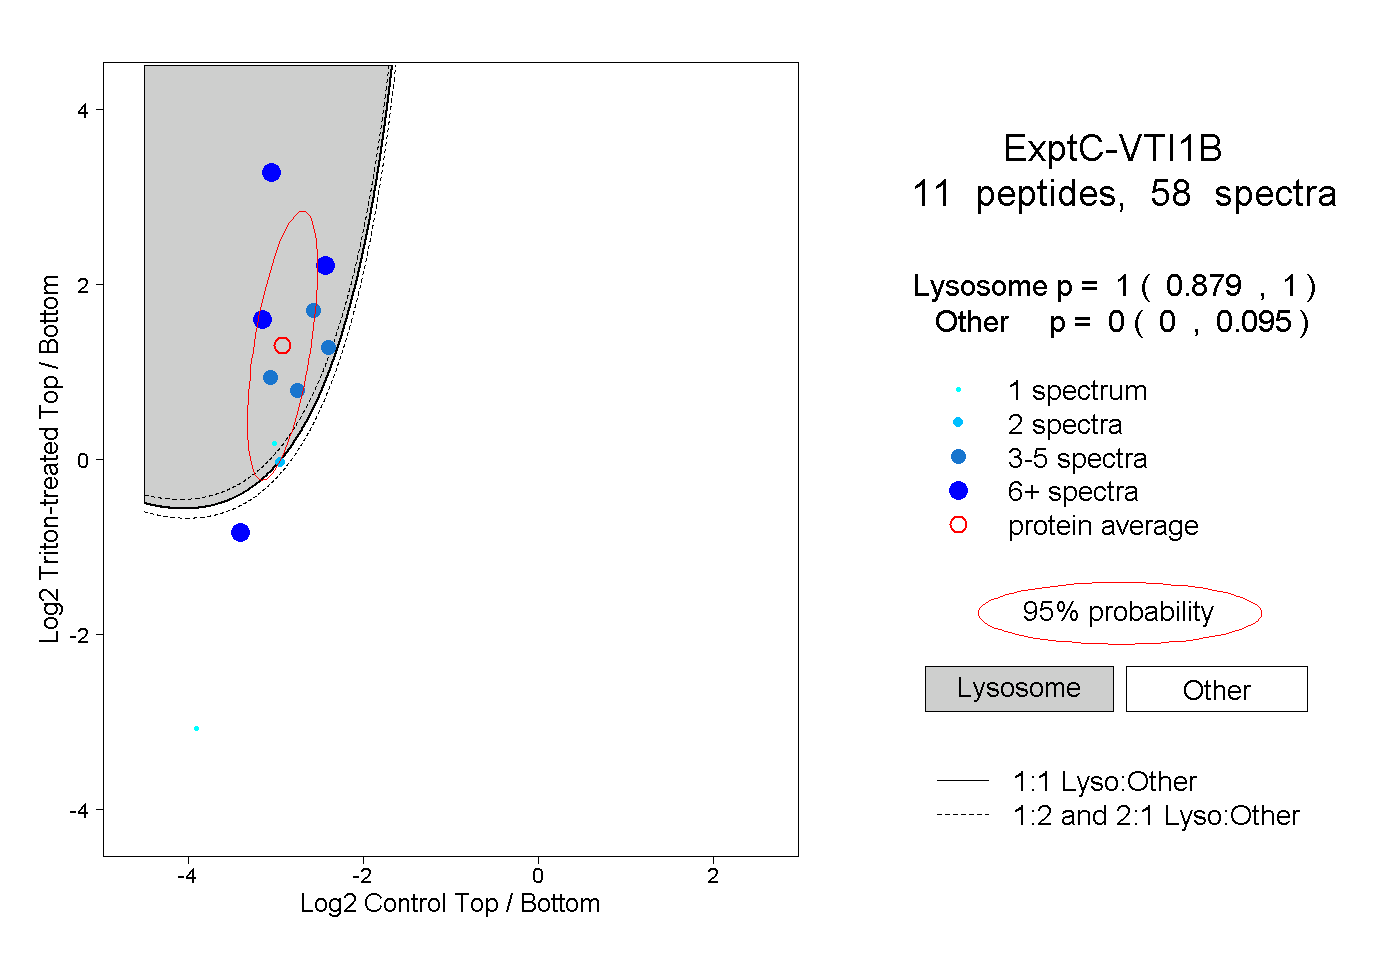 |
1.000 0.879 | 1.000 |
0.000 0.000 | 0.095 |
||||||||
| Plot | Lyso | Other | |||||||||||
| Expt D |
3 peptides |
5 spectra |
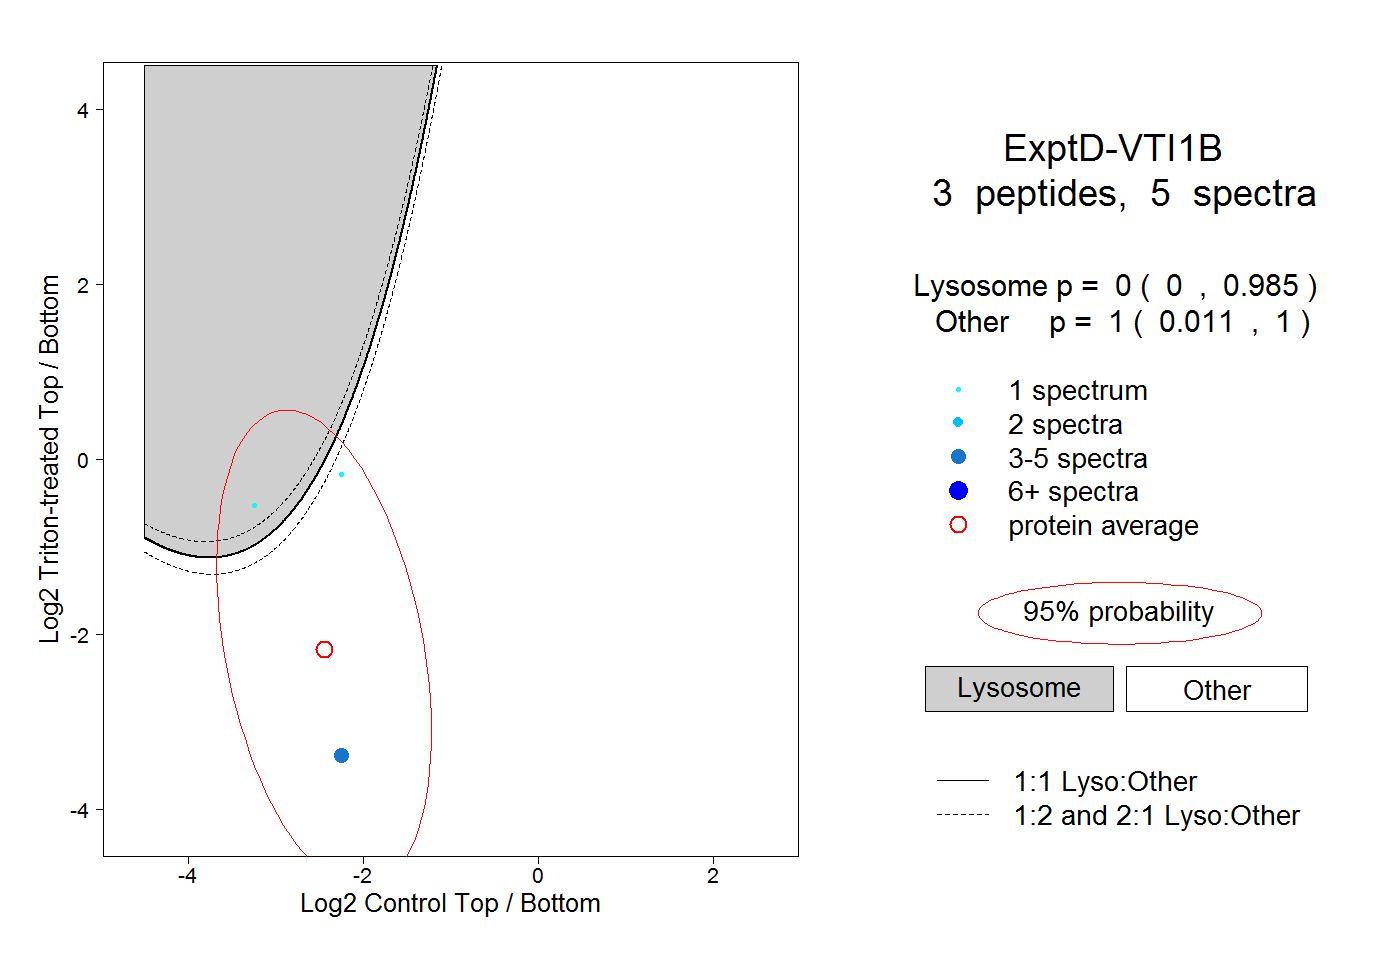 |
0.000 0.000 | 0.985 |
1.000 0.011 | 1.000 |