SLC37A4
[ENSRNOP00000015810]
Main page
| | | Plot |
Mito |
Lyso |
|
Perox |
ER |
Golgi |
PM |
Cytosol |
Nucleus |
|
| Expt A |
 5
5
peptides |
54
spectra |
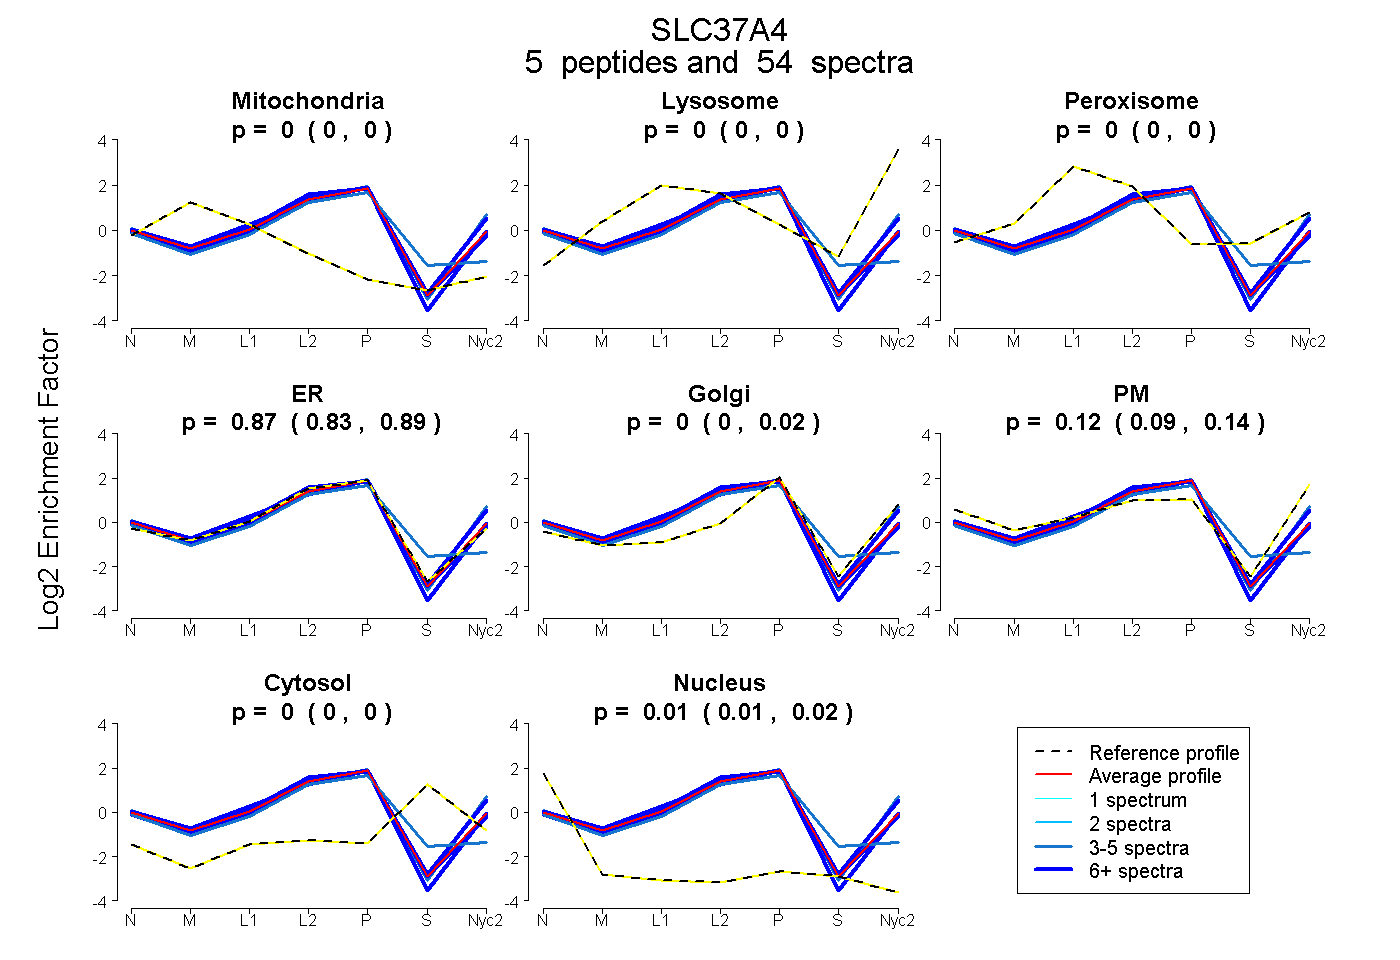 |
0.000
0.000 | 0.000 |
0.000
0.000 | 0.000 |
|
0.000
0.000 | 0.000 |
0.868
0.833 | 0.891 |
0.002
0.000 | 0.017 |
0.119
0.088 | 0.140 |
0.000
0.000 | 0.000 |
0.012
0.006 | 0.016 |
|
| | | Plot |
Mito |
|
Lyso or Perox |
|
ER |
Golgi |
PM |
Cytosol |
Nucleus |
|
| Expt B |
3
peptides |
7
spectra |
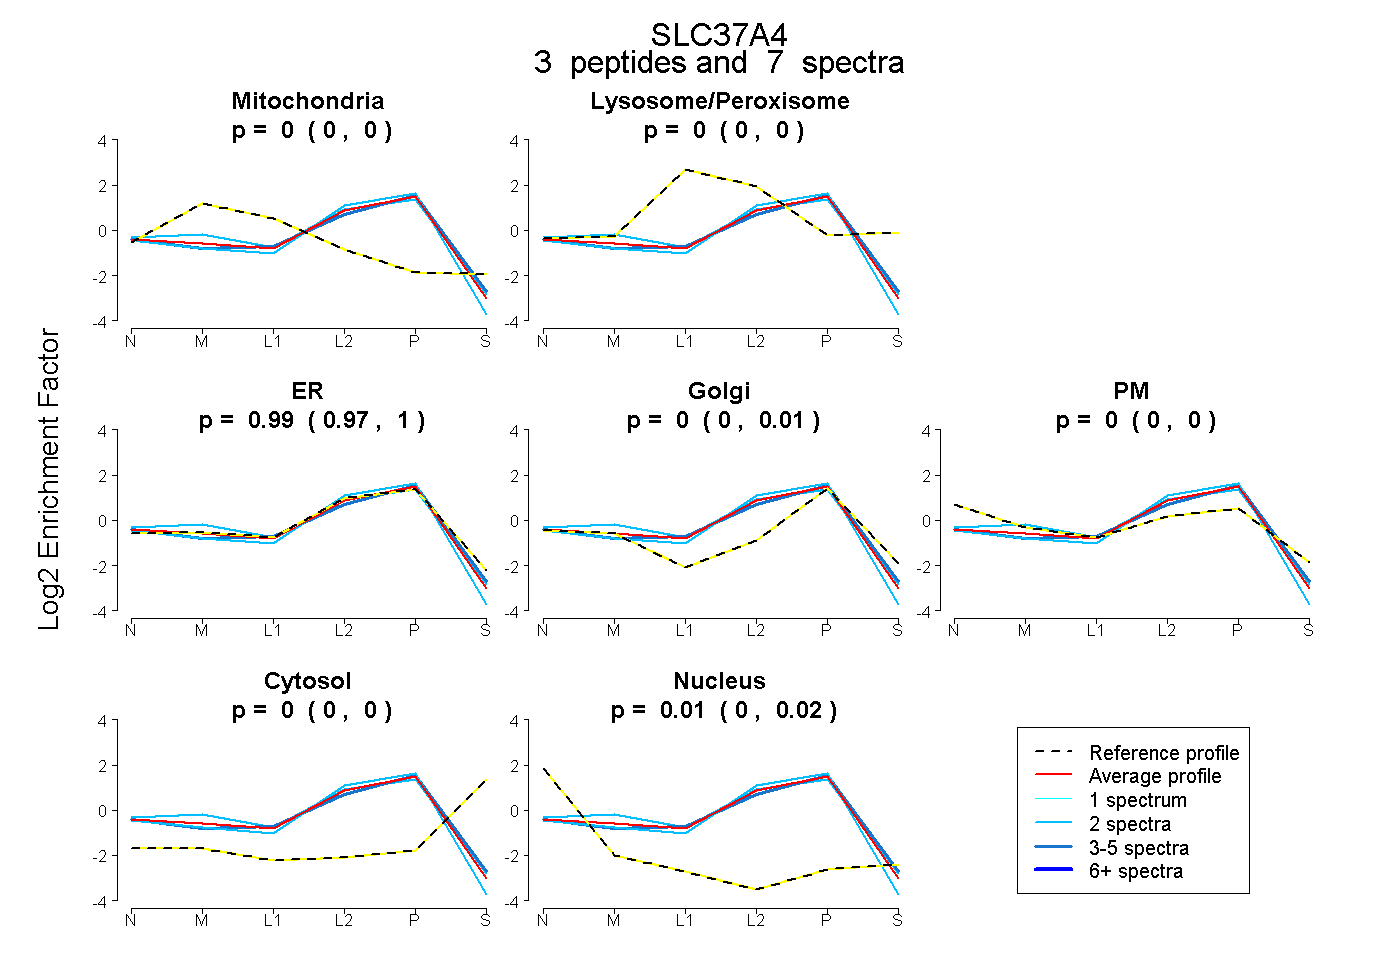 |
0.000
0.000 | 0.000 |
|
0.000
0.000 | 0.000 |
|
0.986
0.969 | 0.996 |
0.000
0.000 | 0.006 |
0.000
0.000 | 0.000 |
0.000
0.000 | 0.000 |
0.014
0.002 | 0.023 |
|
| 2 spectra, NLDPAPSK |
0.000 |
|
0.000 |
|
1.000 |
0.000 |
0.000 |
0.000 |
0.000 |
|
| 3 spectra, FVSGVLSDQMSAR |
0.000 |
|
0.000 |
|
0.962 |
0.011 |
0.000 |
0.000 |
0.026 |
|
| 2 spectra, AGLSVYGNPR |
0.023 |
|
0.000 |
|
0.920 |
0.000 |
0.057 |
0.000 |
0.000 |
|
| | | Plot |
|
Lyso |
|
|
|
|
|
|
|
Other |
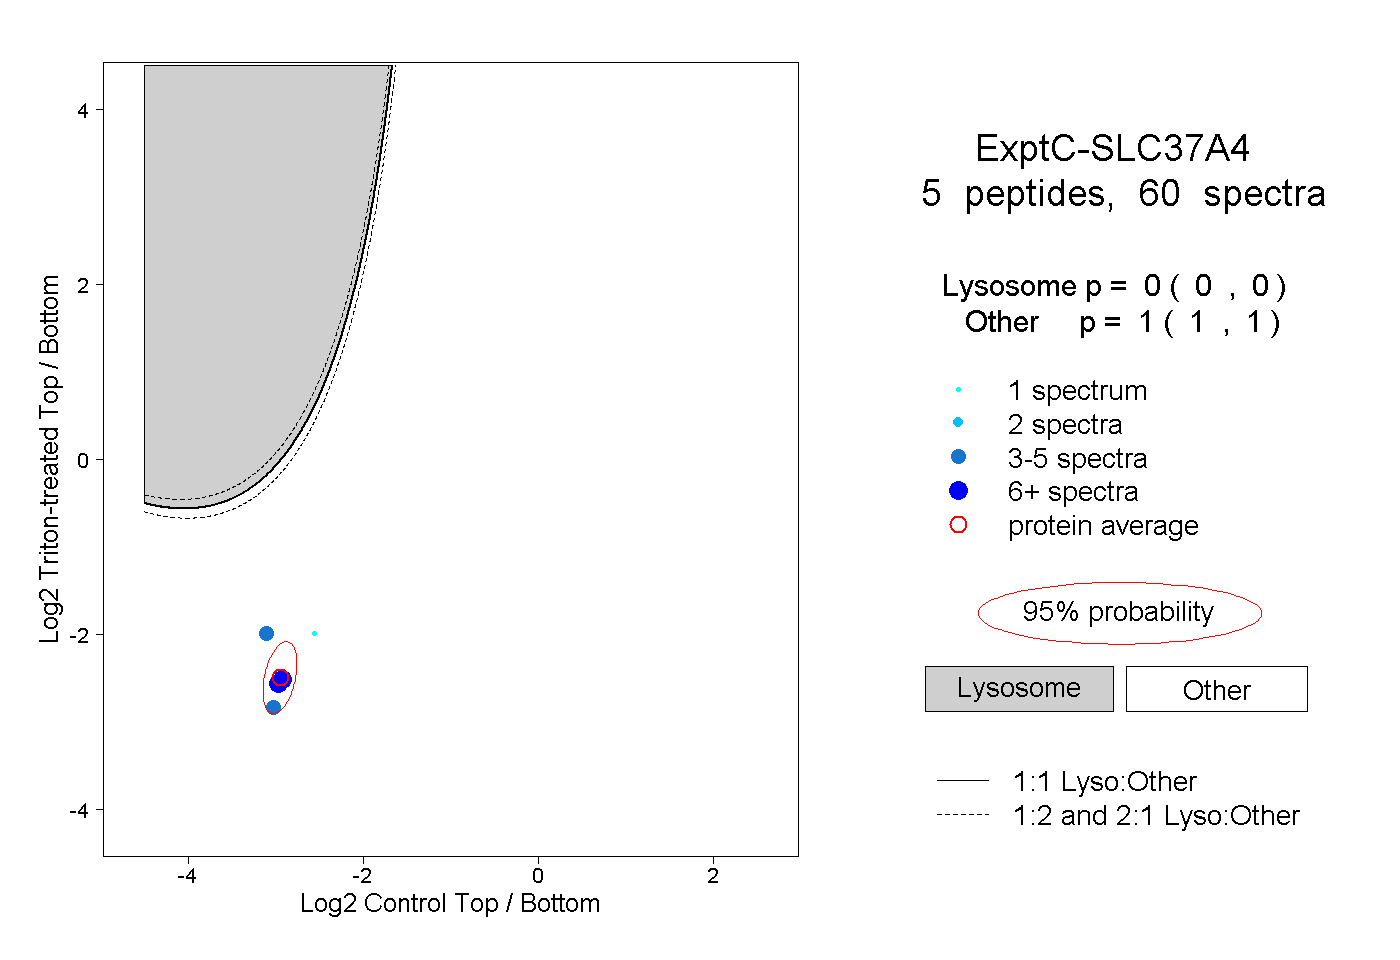
| Expt C |
5
peptides |
60
spectra |
 |
|
0.000
0.000 | 0.000 |
|
|
|
|
|
|
|
1.000
1.000 | 1.000 |
| | | Plot |
|
Lyso |
|
|
|
|
|
|
|
Other |
| Expt D |
1
peptide |
1
spectrum |
 |
|
0.000
NA | NA |
|
|
|
|
|
|
|
1.000
NA | NA |