 5
5peptides
spectra
0.000 | 0.000
0.000 | 0.000
0.000 | 0.000
0.833 | 0.891
0.000 | 0.017
0.088 | 0.140
0.000 | 0.000
0.006 | 0.016
| Plot | Mito | Lyso | Perox | ER | Golgi | PM | Cytosol | Nucleus | |||||
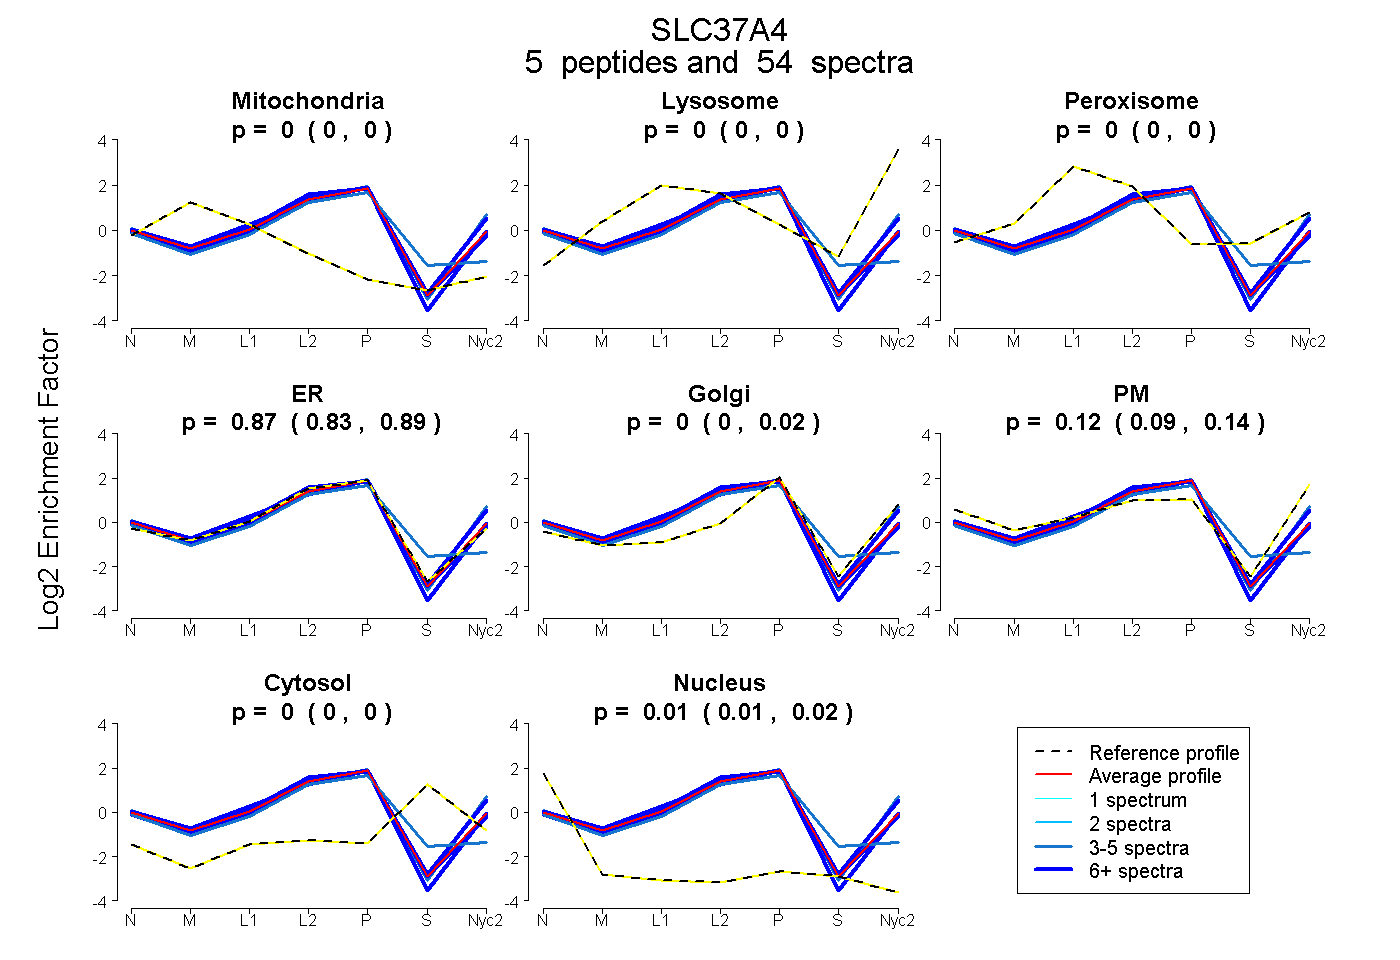
| Expt A |
5 peptides |
54 spectra |
|
0.000 0.000 | 0.000 |
0.000 0.000 | 0.000 |
0.000 0.000 | 0.000 |
0.868 0.833 | 0.891 |
0.002 0.000 | 0.017 |
0.119 0.088 | 0.140 |
0.000 0.000 | 0.000 |
0.012 0.006 | 0.016 |
| 9 spectra, NLDPAPSK | 0.000 | 0.000 | 0.000 | 0.924 | 0.028 | 0.029 | 0.000 | 0.019 | ||
| 12 spectra, FVSGVLSDQMSAR | 0.000 | 0.000 | 0.000 | 0.683 | 0.000 | 0.317 | 0.000 | 0.000 | ||
| 24 spectra, AGLSVYGNPR | 0.002 | 0.000 | 0.000 | 0.861 | 0.000 | 0.130 | 0.000 | 0.008 | ||
| 4 spectra, TCCTDWGQFFLIQER | 0.000 | 0.000 | 0.000 | 0.821 | 0.000 | 0.000 | 0.145 | 0.034 | ||
| 5 spectra, AAQGYGYYR | 0.000 | 0.000 | 0.000 | 0.598 | 0.034 | 0.368 | 0.000 | 0.000 |
| Plot | Mito | Lyso or Perox | ER | Golgi | PM | Cytosol | Nucleus | ||||||
| Expt B |
3 peptides |
7 spectra |
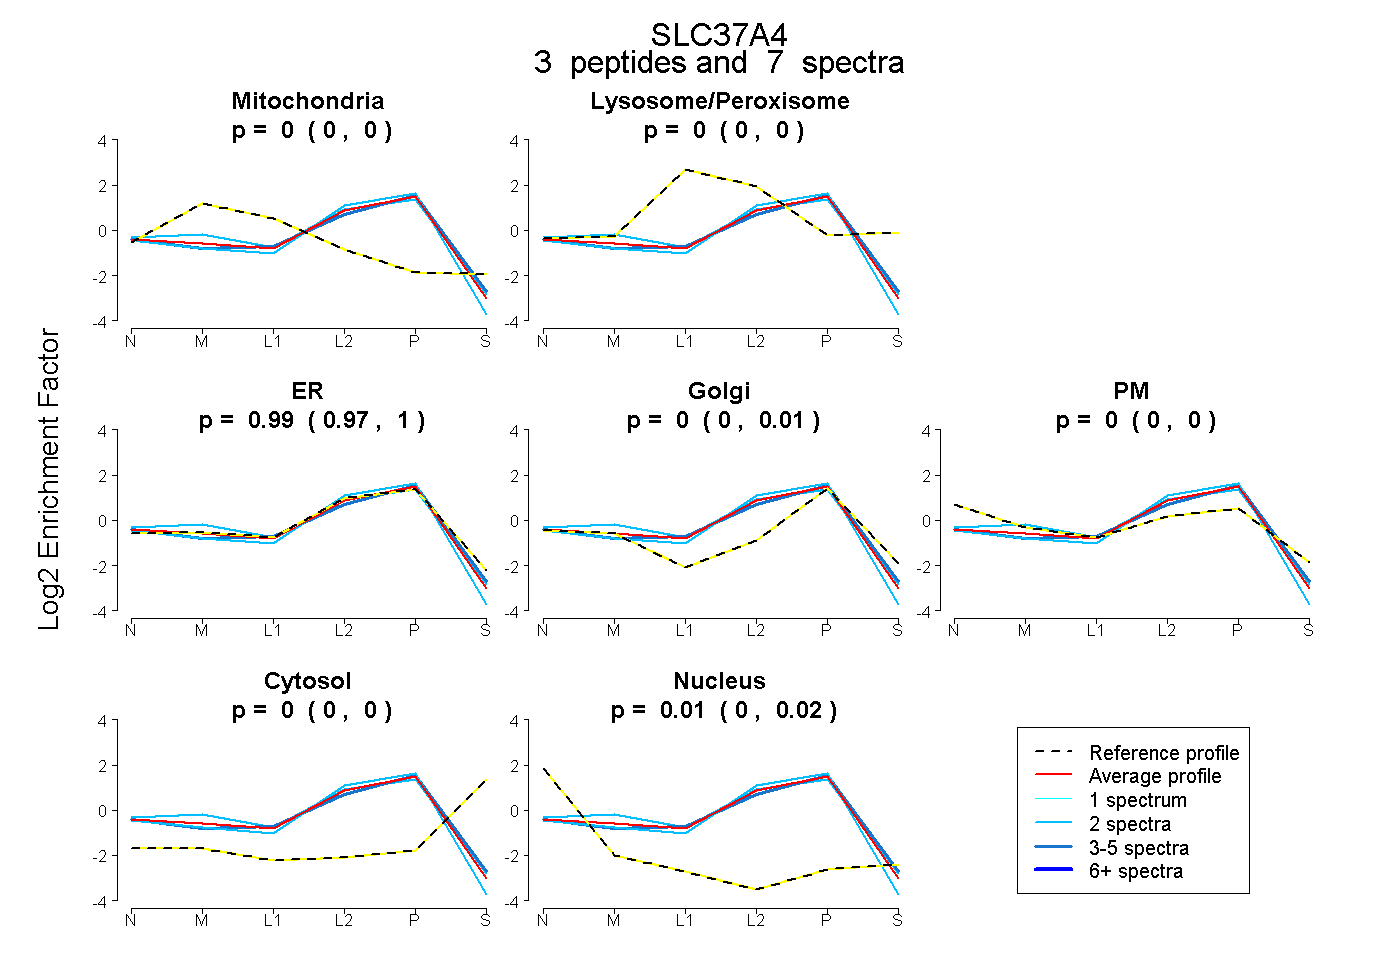 |
0.000 0.000 | 0.000 |
0.000 0.000 | 0.000 |
0.986 0.969 | 0.996 |
0.000 0.000 | 0.006 |
0.000 0.000 | 0.000 |
0.000 0.000 | 0.000 |
0.014 0.002 | 0.023 |
|||
| Plot | Lyso | Other | |||||||||||
| Expt C |
5 peptides |
60 spectra |
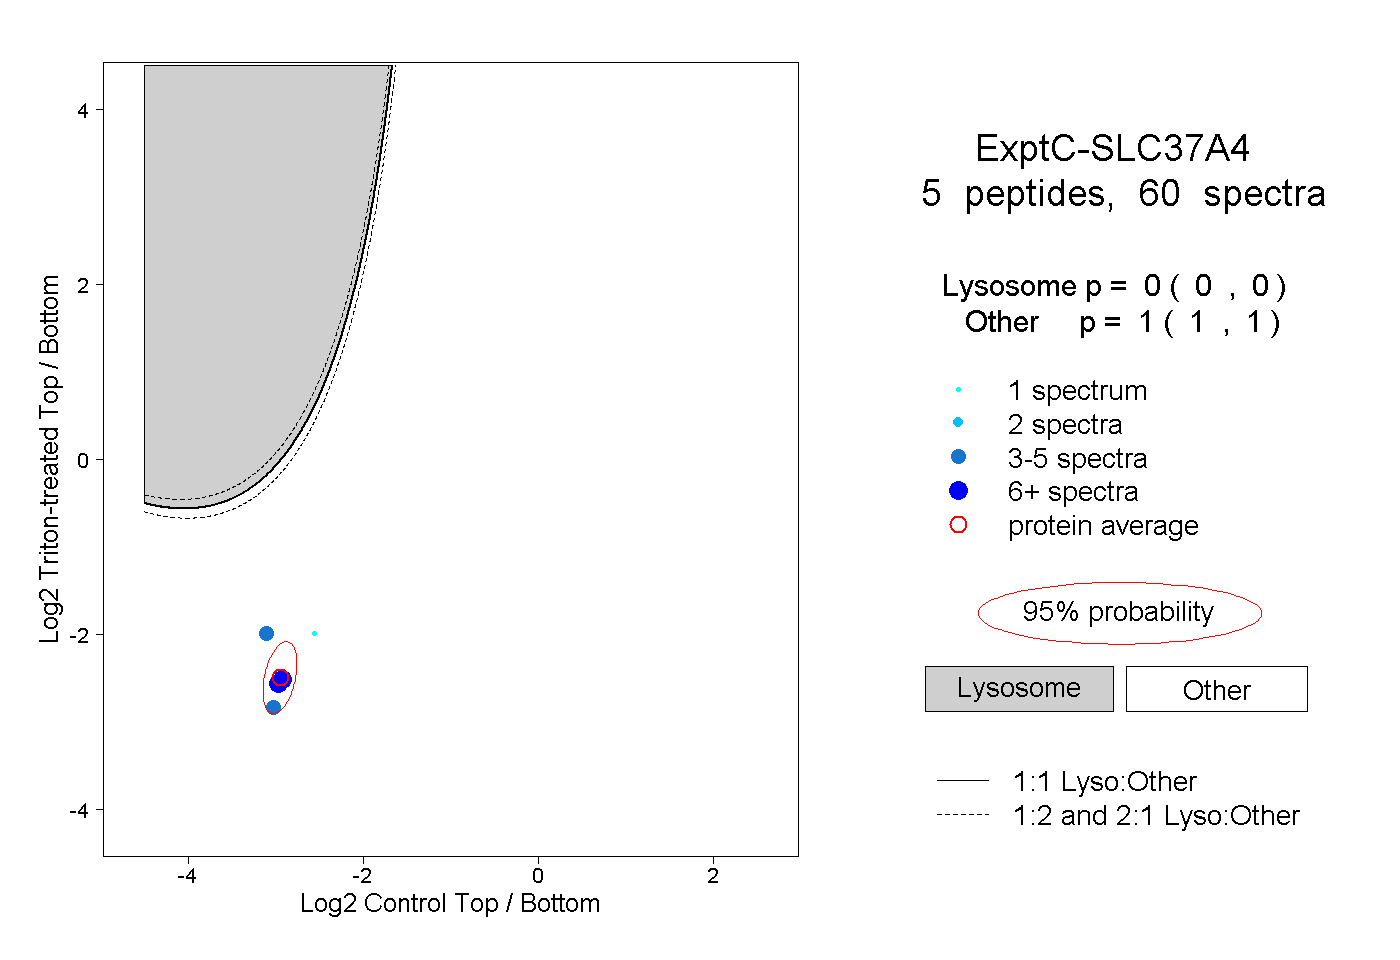 |
0.000 0.000 | 0.000 |
1.000 1.000 | 1.000 |
||||||||
| Plot | Lyso | Other | |||||||||||
| Expt D |
1 peptide |
1 spectrum |
 |
0.000 NA | NA |
1.000 NA | NA |