 2
2peptides
spectra
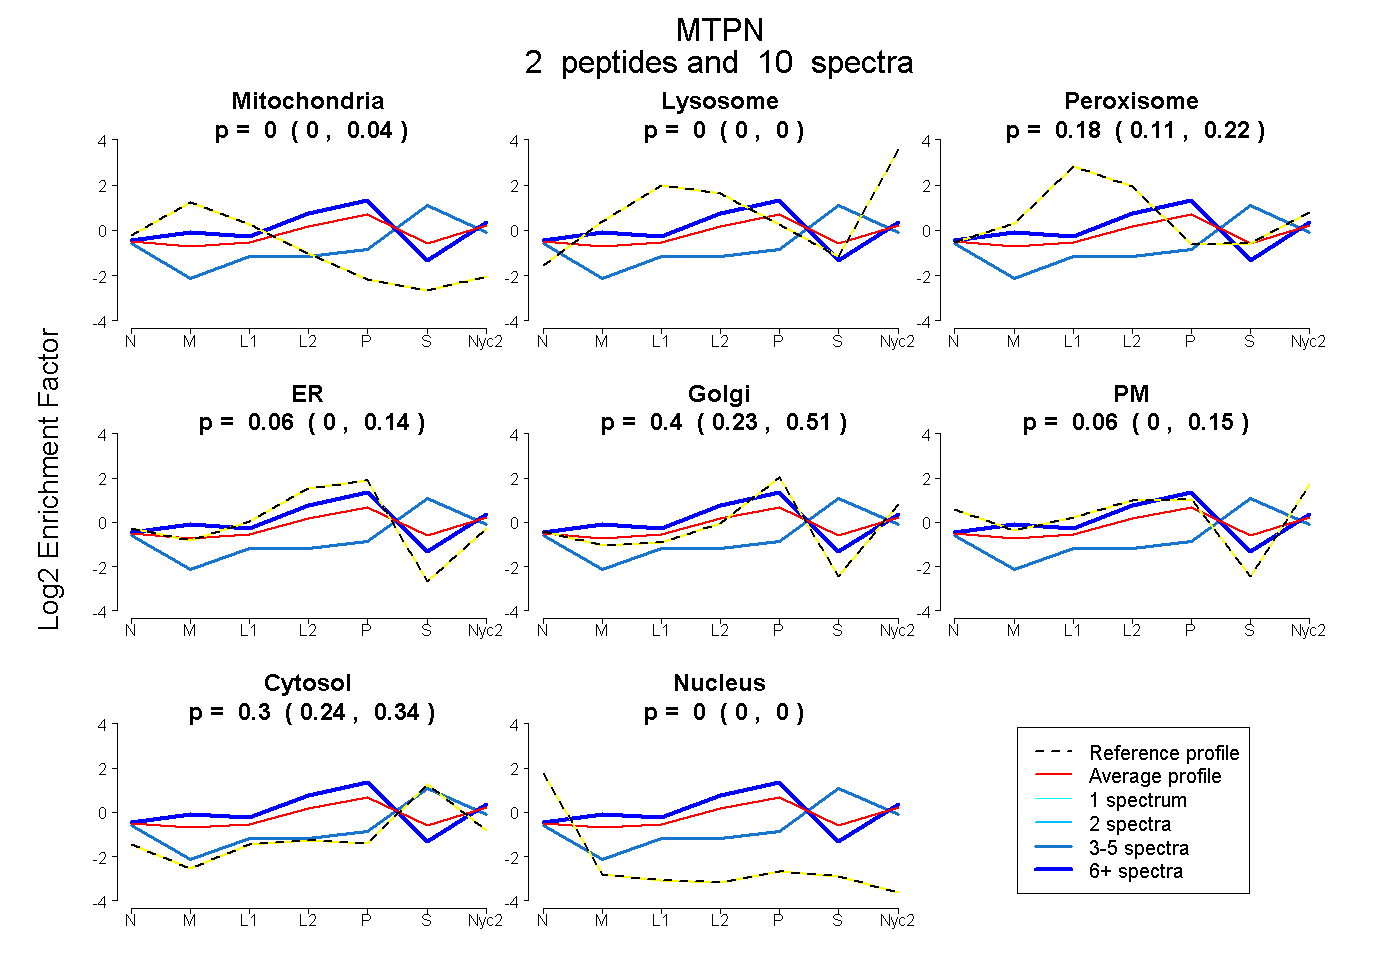
0.000 | 0.043
0.000 | 0.003
0.110 | 0.215
0.000 | 0.142
0.225 | 0.509
0.000 | 0.148
0.244 | 0.337
0.000 | 0.000
2peptides
spectra
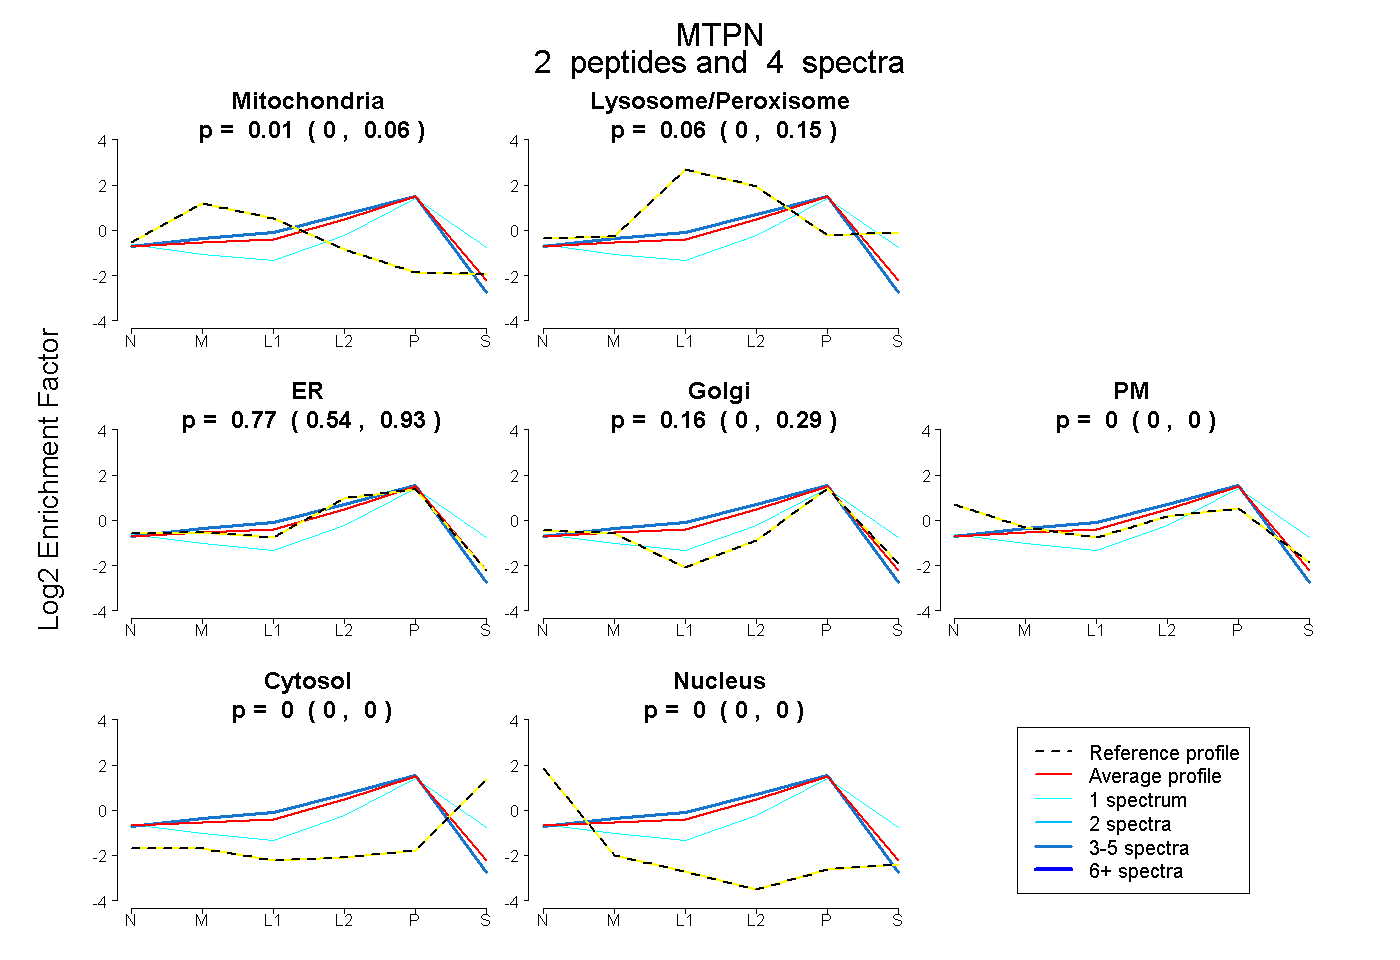
0.000 | 0.056
0.000 | 0.152
0.542 | 0.932
0.000 | 0.294
0.000 | 0.000
0.000 | 0.000
0.000 | 0.000
4peptides
spectra
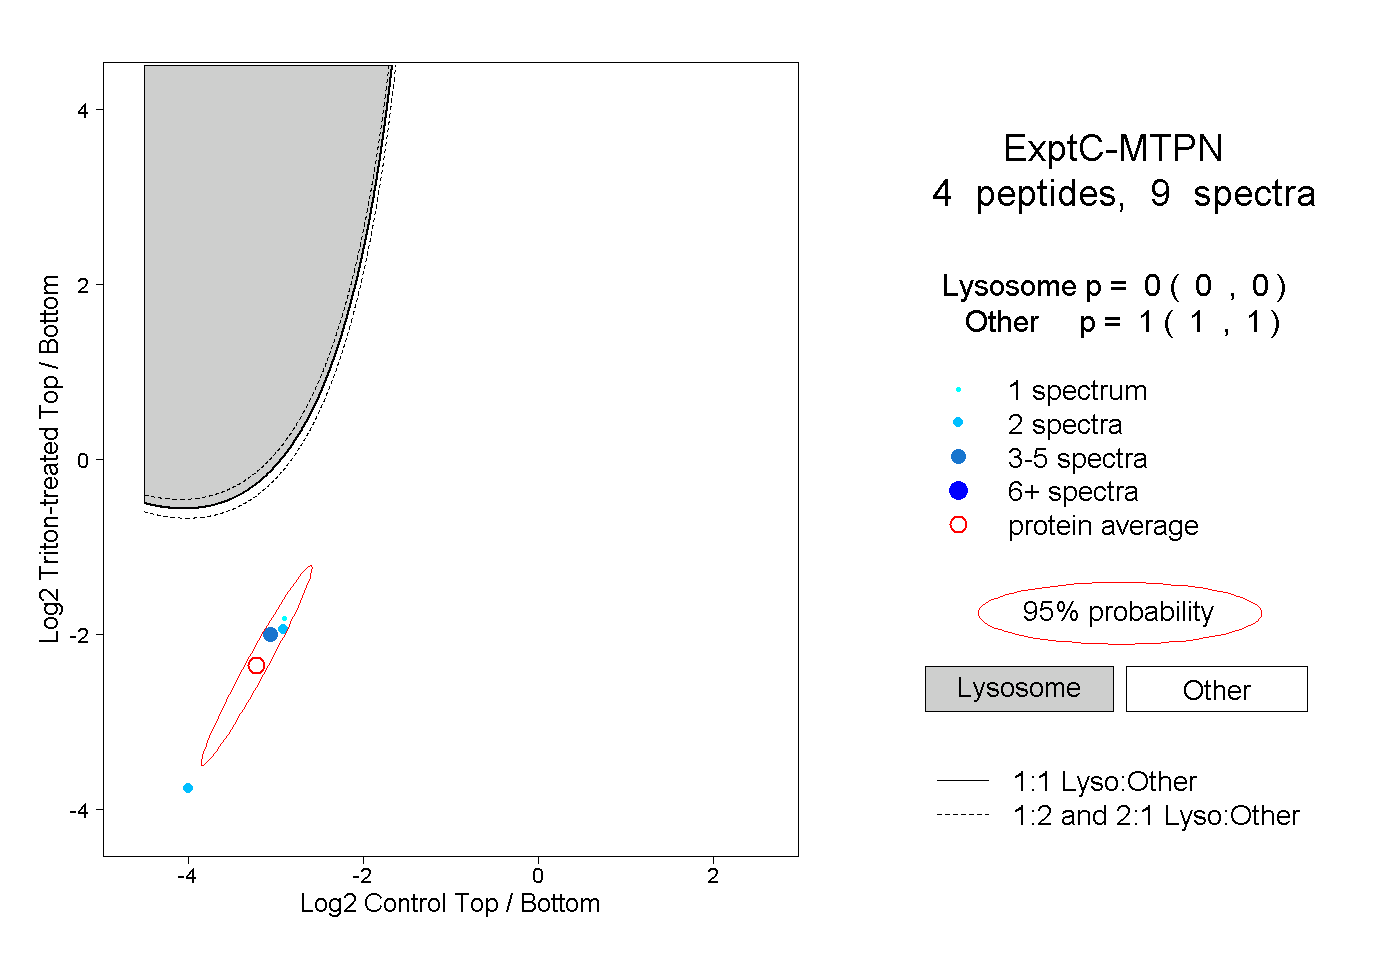
0.000 | 0.000
1.000 | 1.000