5
5peptides
spectra
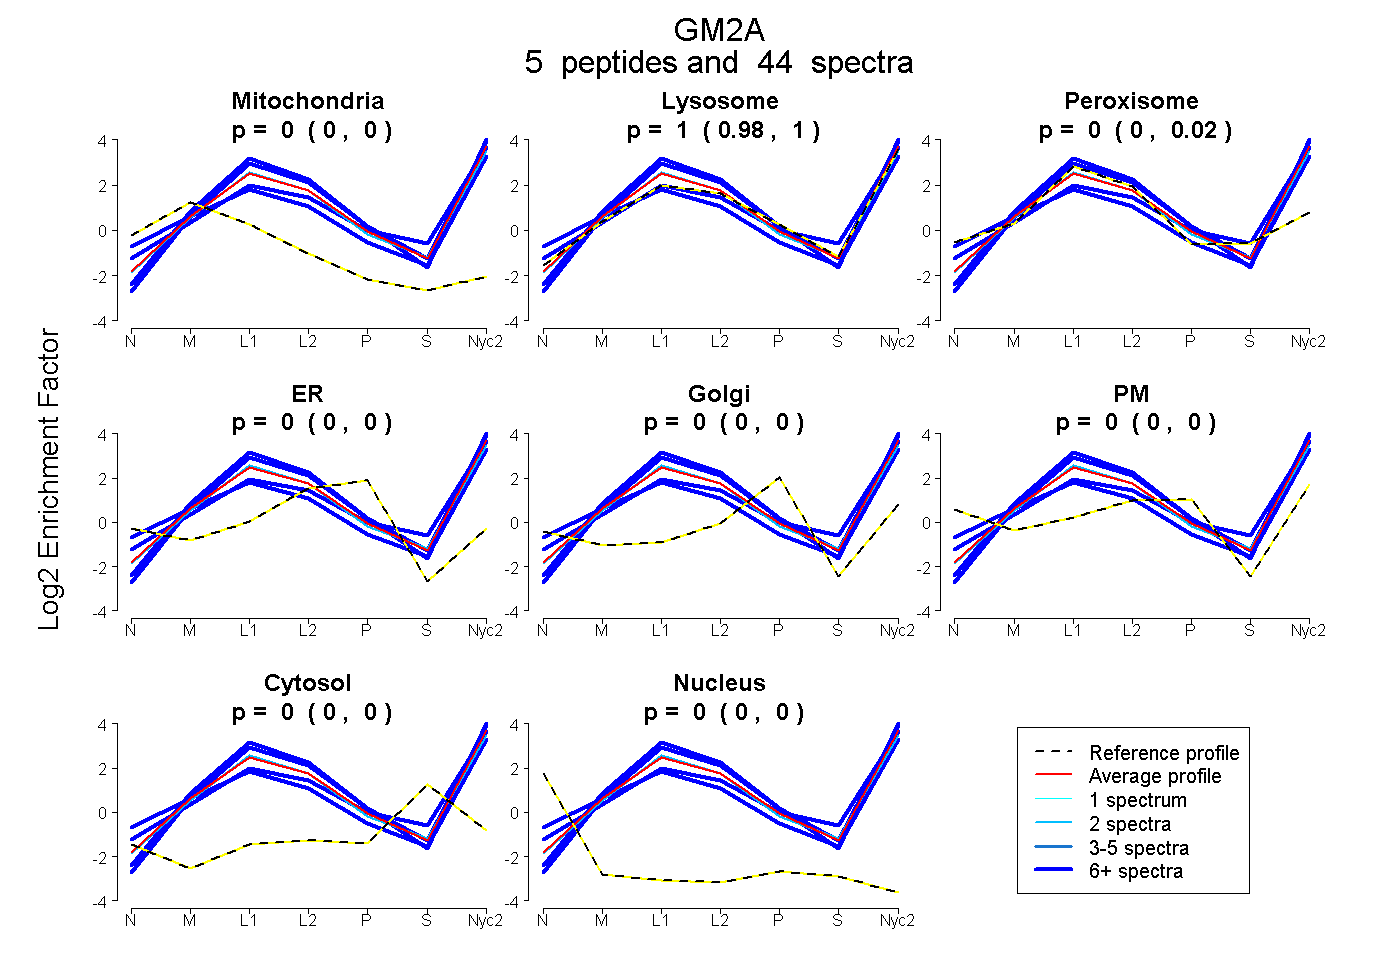
0.000 | 0.000
0.981 | 1.000
0.000 | 0.016
0.000 | 0.000
0.000 | 0.000
0.000 | 0.000
0.000 | 0.000
0.000 | 0.000
6peptides
spectra
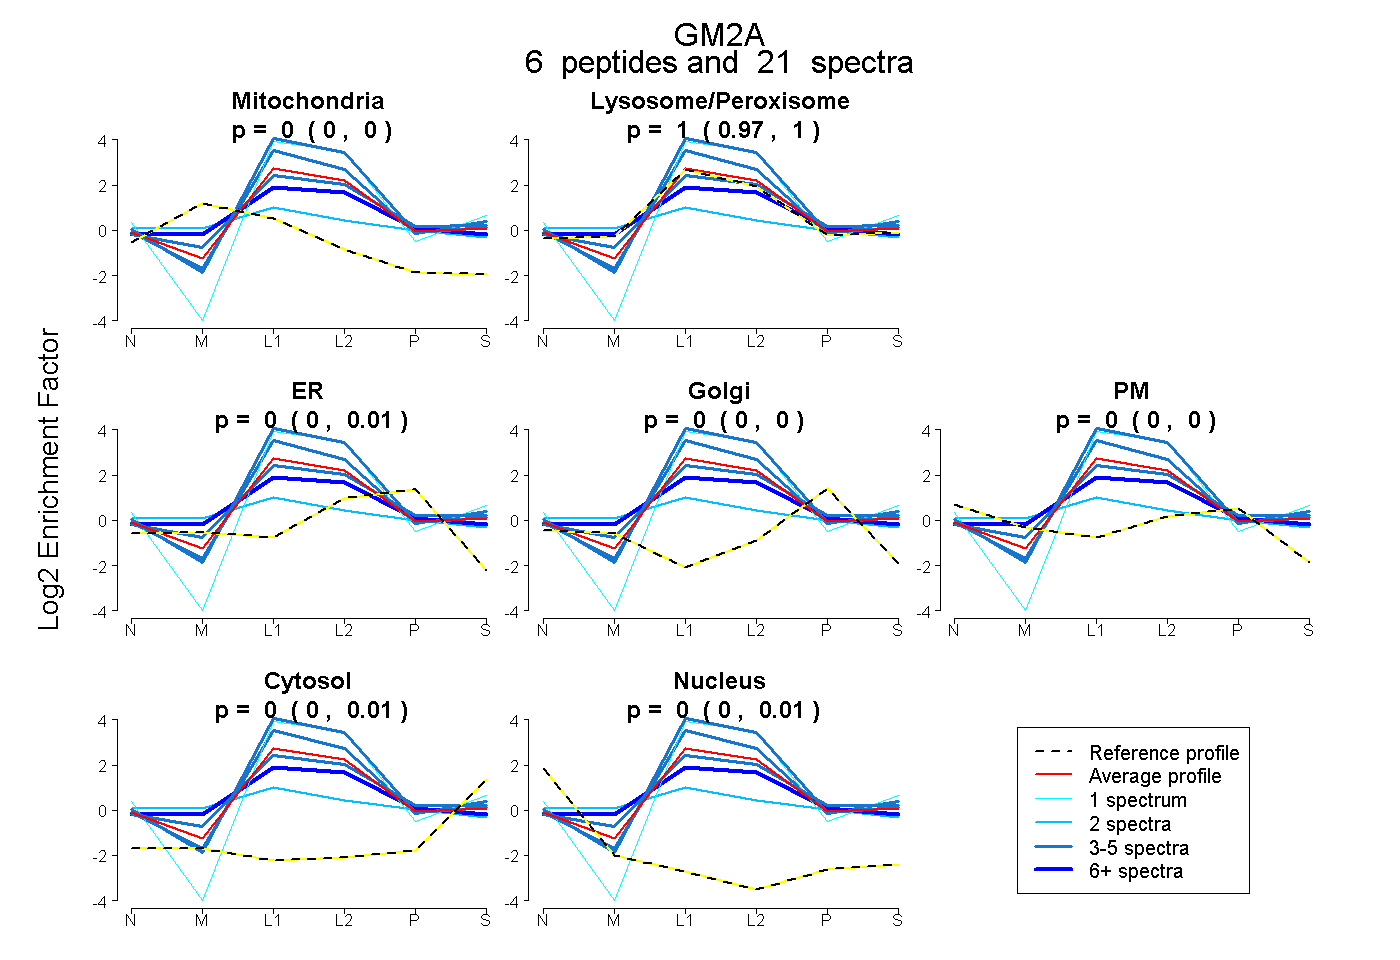
0.000 | 0.000
0.973 | 1.000
0.000 | 0.006
0.000 | 0.000
0.000 | 0.000
0.000 | 0.014
0.000 | 0.006
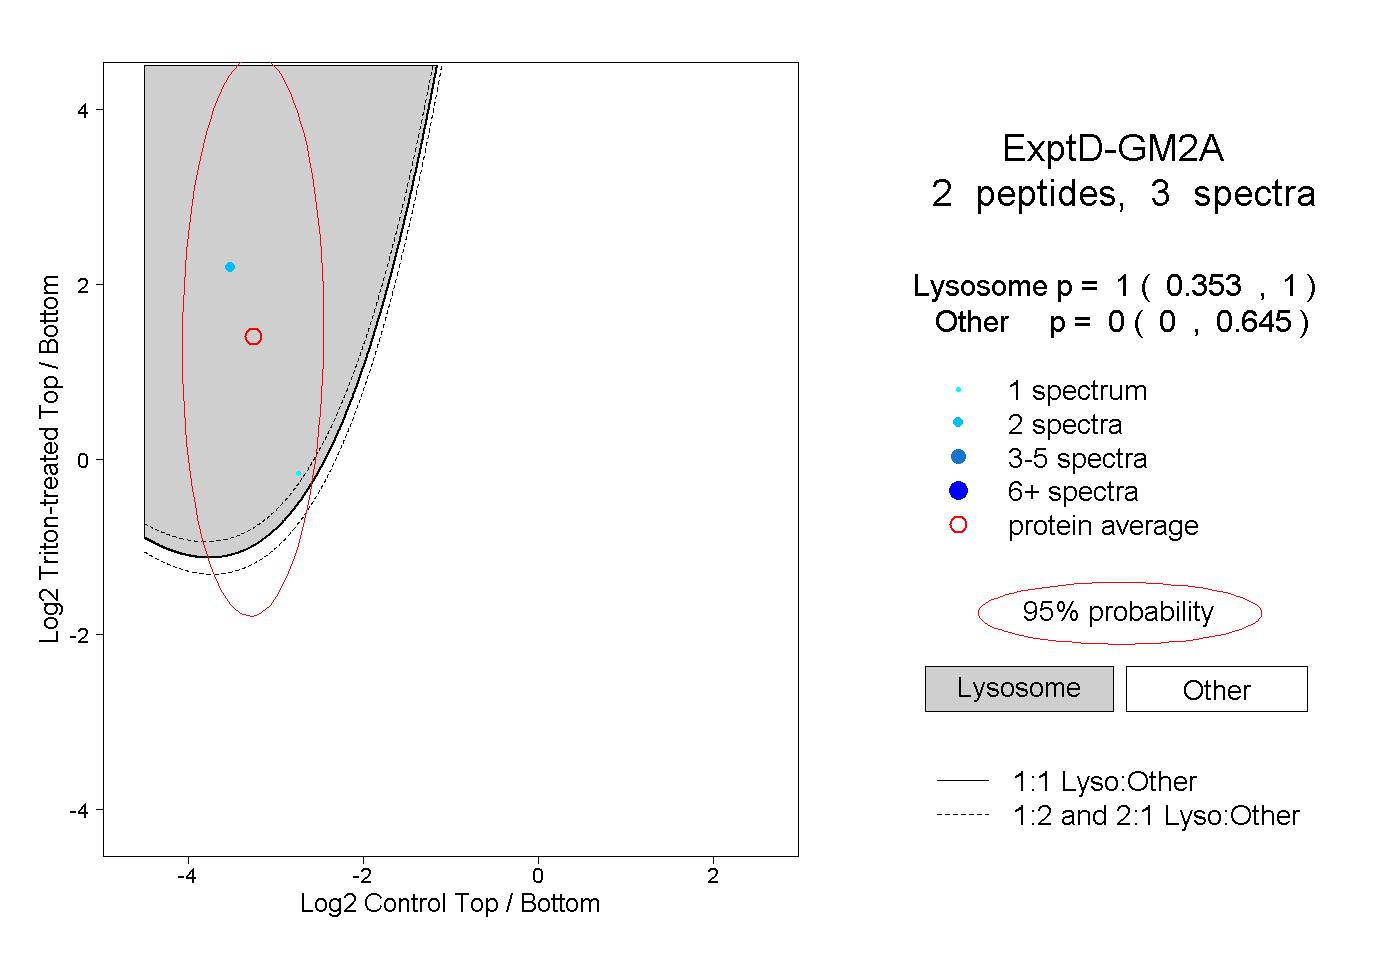
7peptides
spectra
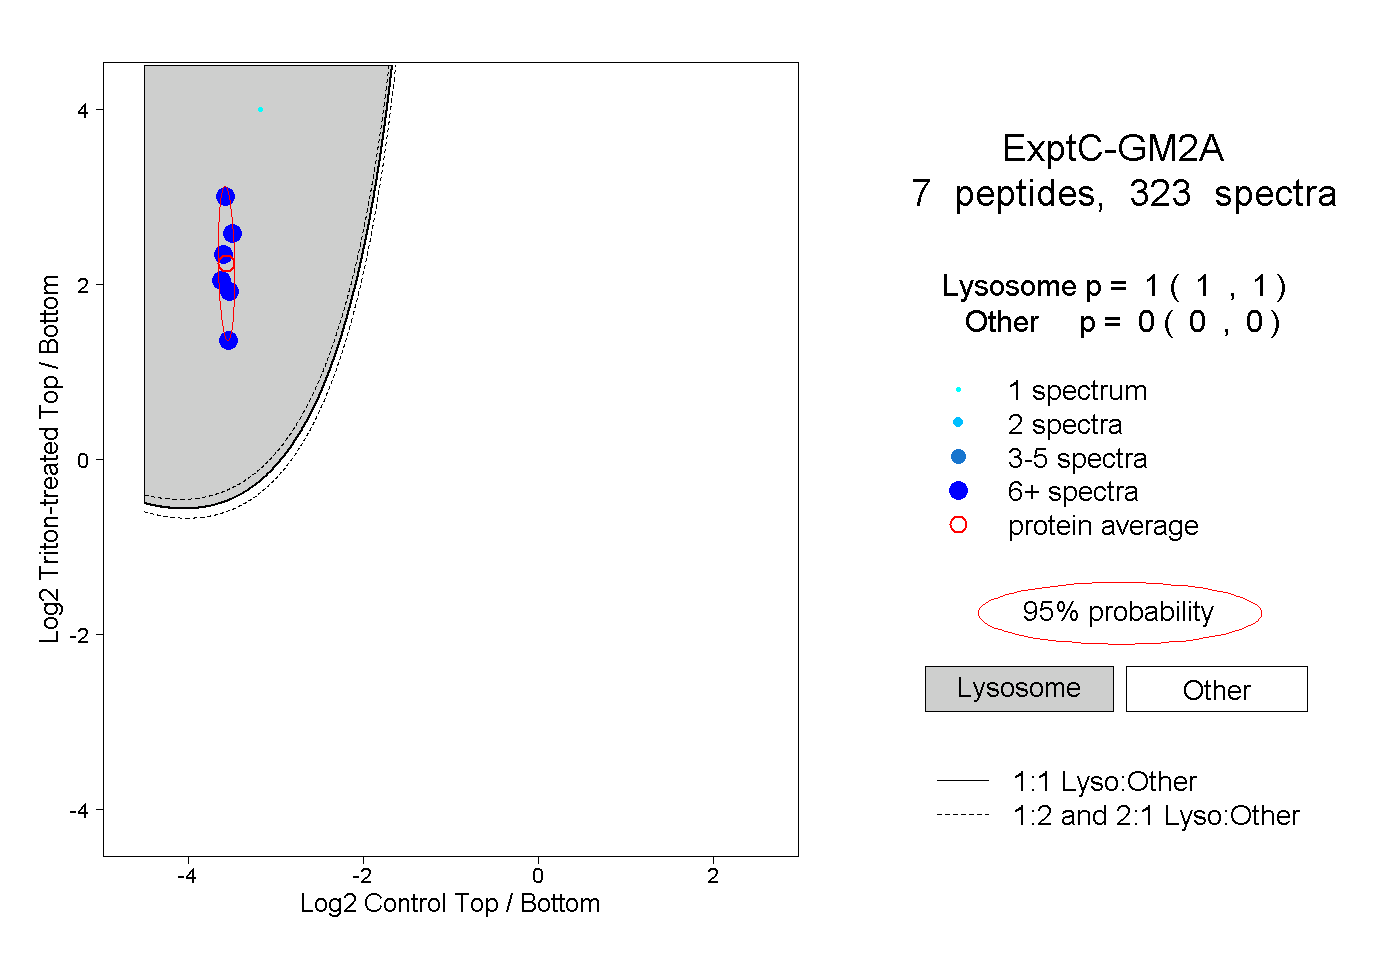
1.000 | 1.000
0.000 | 0.000