 5
5peptides
spectra
0.000 | 0.000
0.981 | 1.000
0.000 | 0.016
0.000 | 0.000
0.000 | 0.000
0.000 | 0.000
0.000 | 0.000
0.000 | 0.000
| Plot | Mito | Lyso | Perox | ER | Golgi | PM | Cytosol | Nucleus | |||||
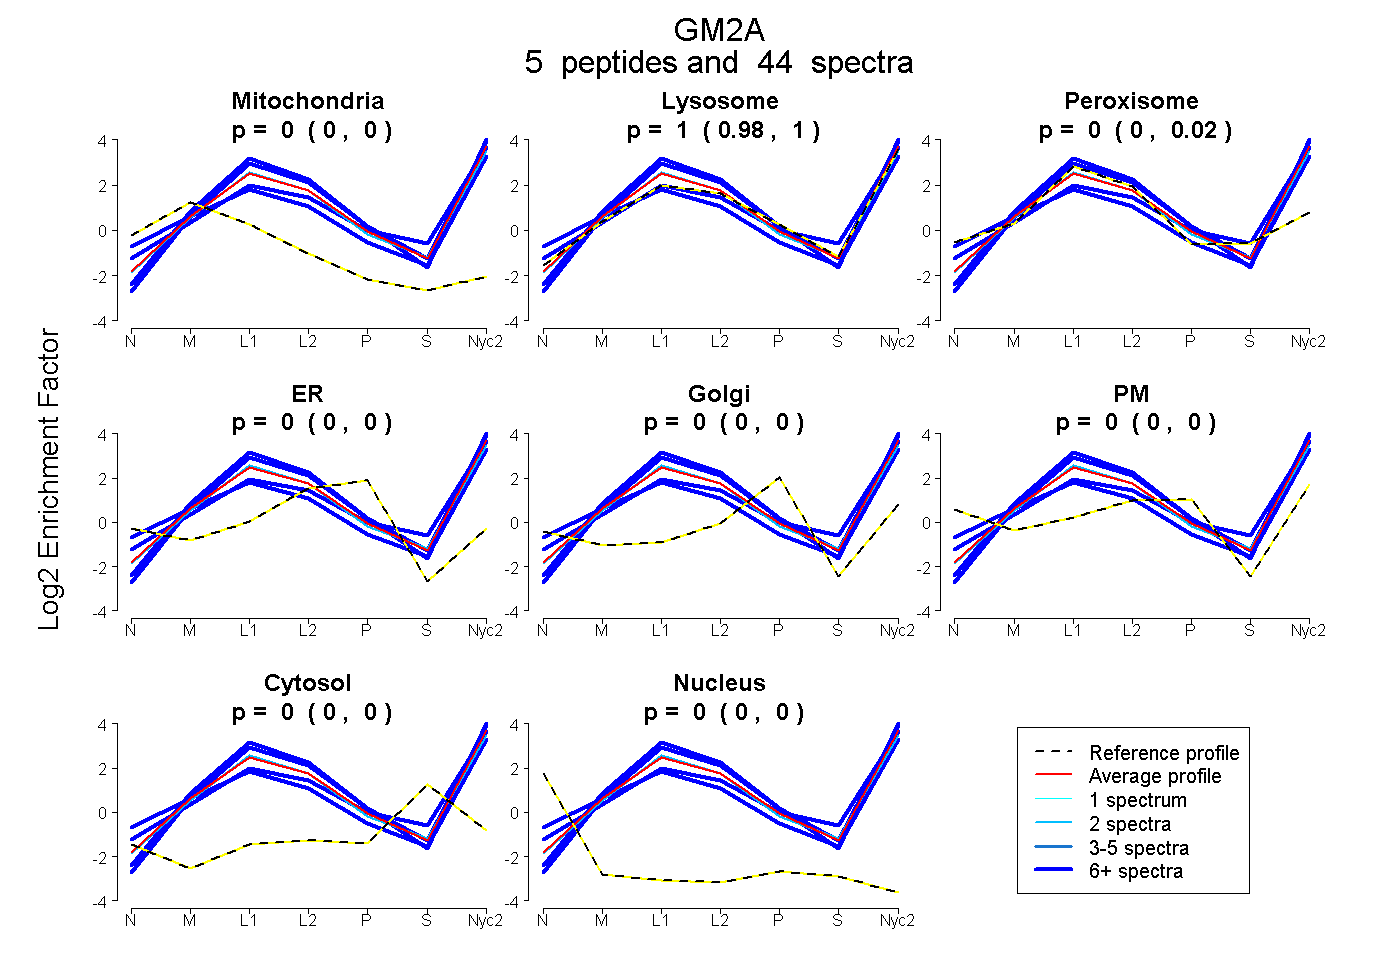
| Expt A |
5 peptides |
44 spectra |
|
0.000 0.000 | 0.000 |
0.999 0.981 | 1.000 |
0.001 0.000 | 0.016 |
0.000 0.000 | 0.000 |
0.000 0.000 | 0.000 |
0.000 0.000 | 0.000 |
0.000 0.000 | 0.000 |
0.000 0.000 | 0.000 |
| 11 spectra, IQSILSSGGK | 0.000 | 0.955 | 0.011 | 0.000 | 0.000 | 0.000 | 0.034 | 0.000 | ||
| 2 spectra, VELTVEK | 0.000 | 0.931 | 0.069 | 0.000 | 0.000 | 0.000 | 0.000 | 0.000 | ||
| 13 spectra, EVAGFWVK | 0.000 | 1.000 | 0.000 | 0.000 | 0.000 | 0.000 | 0.000 | 0.000 | ||
| 10 spectra, TSIPLTSPQK | 0.000 | 1.000 | 0.000 | 0.000 | 0.000 | 0.000 | 0.000 | 0.000 | ||
| 8 spectra, IAASLK | 0.117 | 0.850 | 0.000 | 0.000 | 0.000 | 0.023 | 0.000 | 0.009 |
| Plot | Mito | Lyso or Perox | ER | Golgi | PM | Cytosol | Nucleus | ||||||
| Expt B |
6 peptides |
21 spectra |
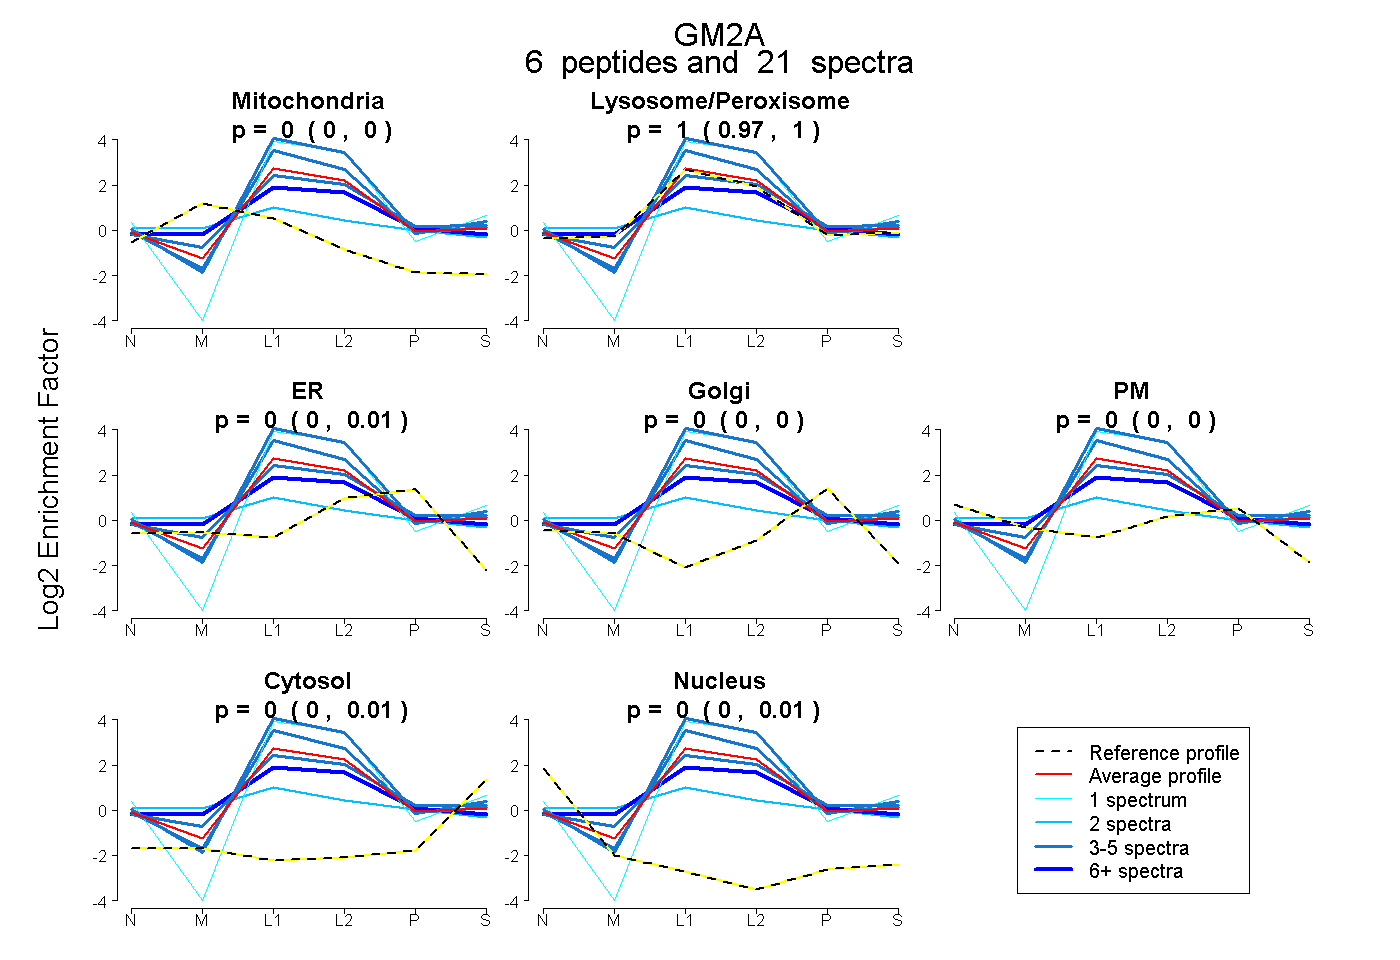 |
0.000 0.000 | 0.000 |
1.000 0.973 | 1.000 |
0.000 0.000 | 0.006 |
0.000 0.000 | 0.000 |
0.000 0.000 | 0.000 |
0.000 0.000 | 0.014 |
0.000 0.000 | 0.006 |
|||
| Plot | Lyso | Other | |||||||||||
| Expt C |
7 peptides |
323 spectra |
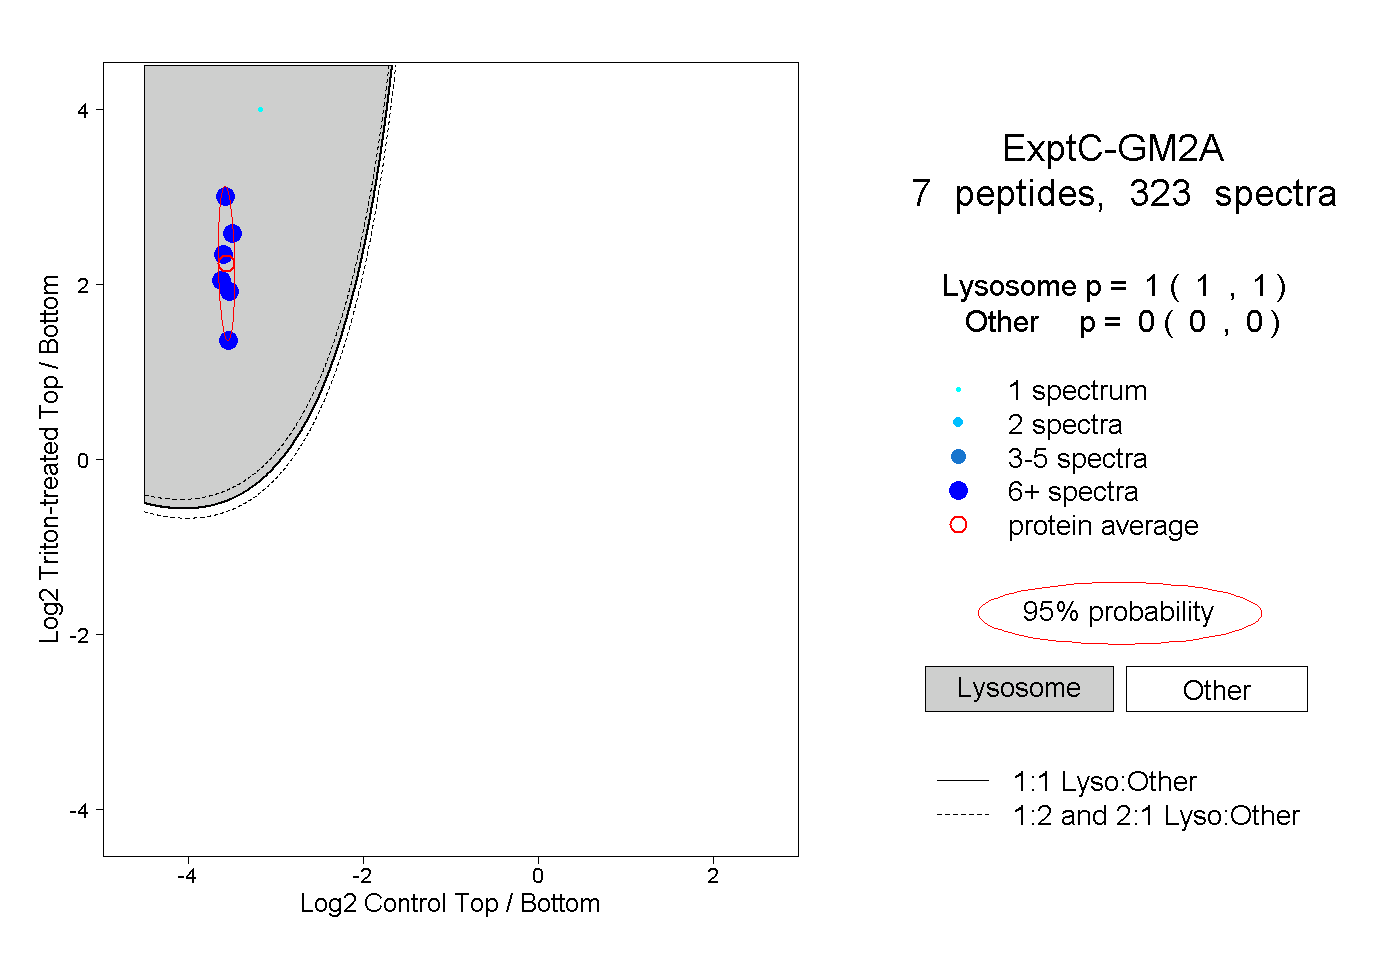 |
1.000 1.000 | 1.000 |
0.000 0.000 | 0.000 |
||||||||
| Plot | Lyso | Other | |||||||||||
| Expt D |
2 peptides |
3 spectra |
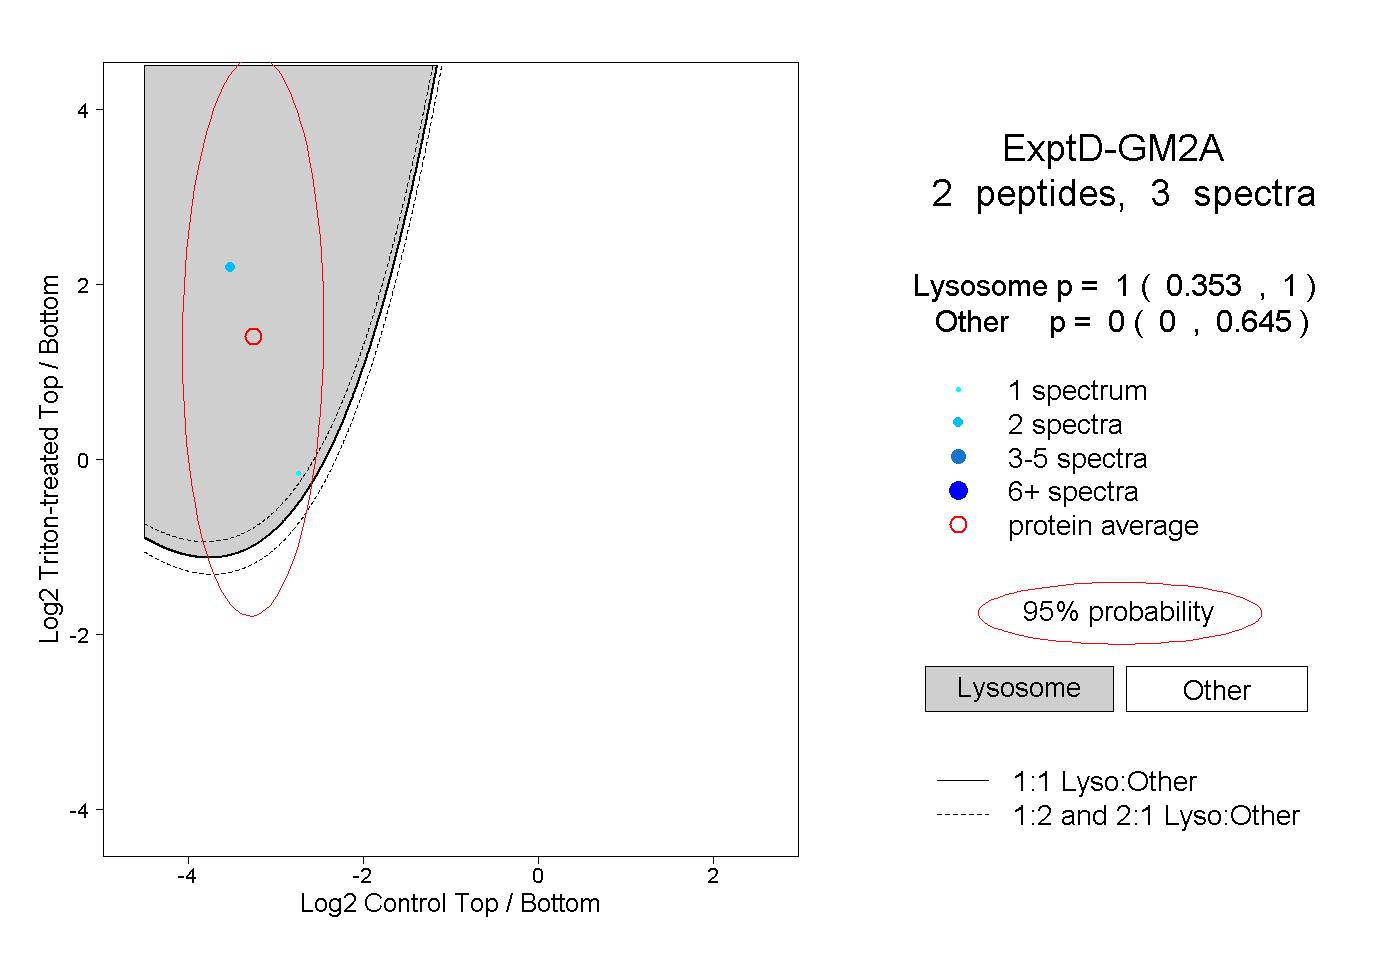 |
1.000 0.353 | 1.000 |
0.000 0.000 | 0.645 |