 2
2peptides
spectra
0.000 | 0.000
0.000 | 0.000
0.000 | 0.000
0.167 | 0.353
0.000 | 0.000
0.000 | 0.000
0.288 | 0.369
0.328 | 0.462
2peptides
spectra
NA | NA
NA | NA
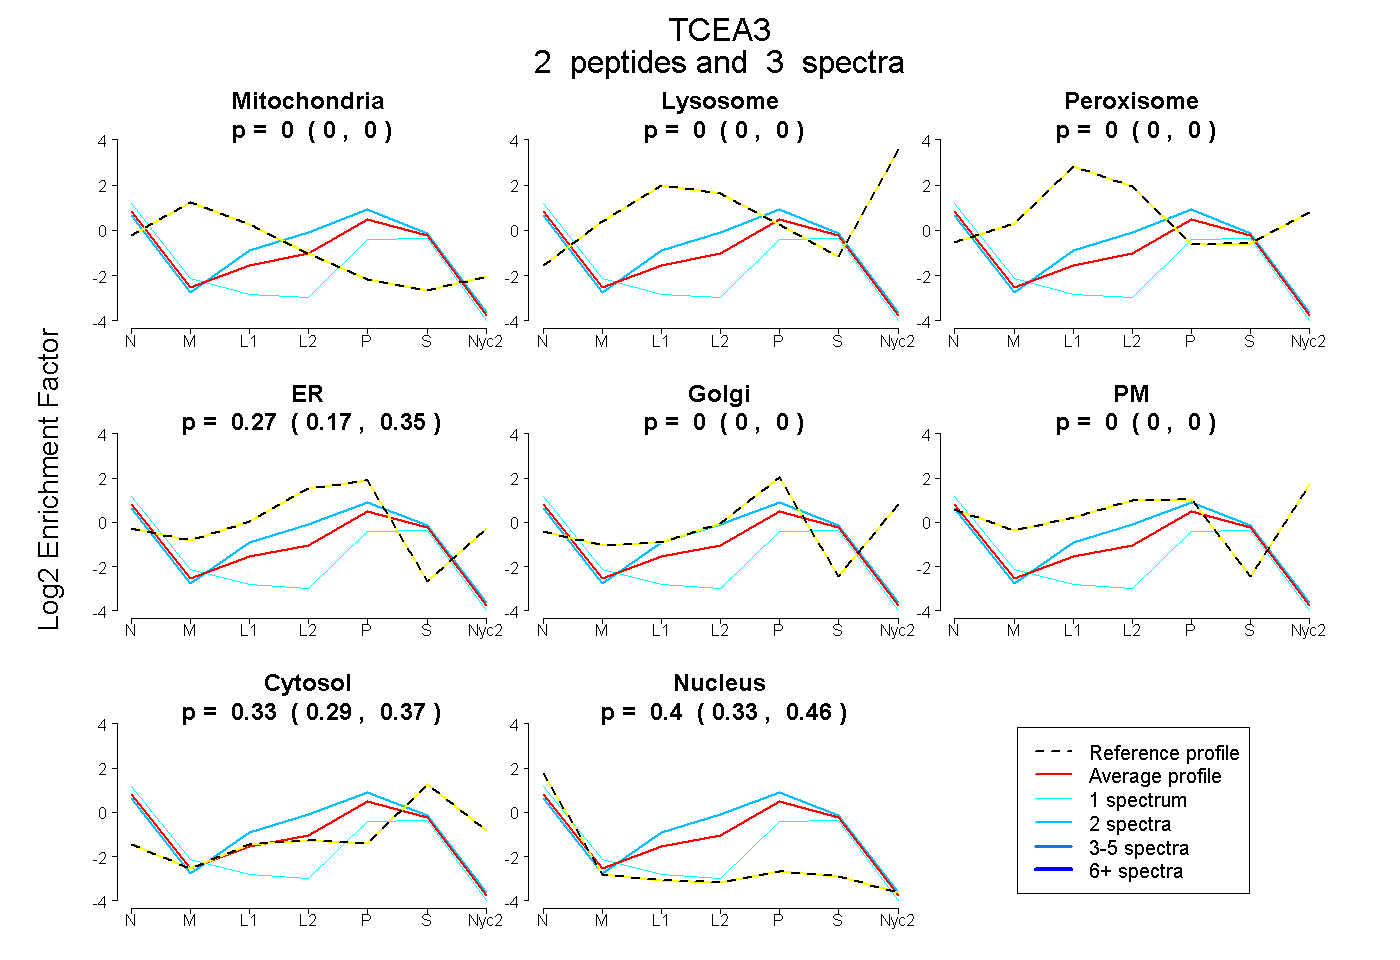
| Plot | Mito | Lyso | Perox | ER | Golgi | PM | Cytosol | Nucleus | |||||
| Expt A |
2 peptides |
3 spectra |
|
0.000 0.000 | 0.000 |
0.000 0.000 | 0.000 |
0.000 0.000 | 0.000 |
0.268 0.167 | 0.353 |
0.000 0.000 | 0.000 |
0.000 0.000 | 0.000 |
0.332 0.288 | 0.369 |
0.400 0.328 | 0.462 |
||
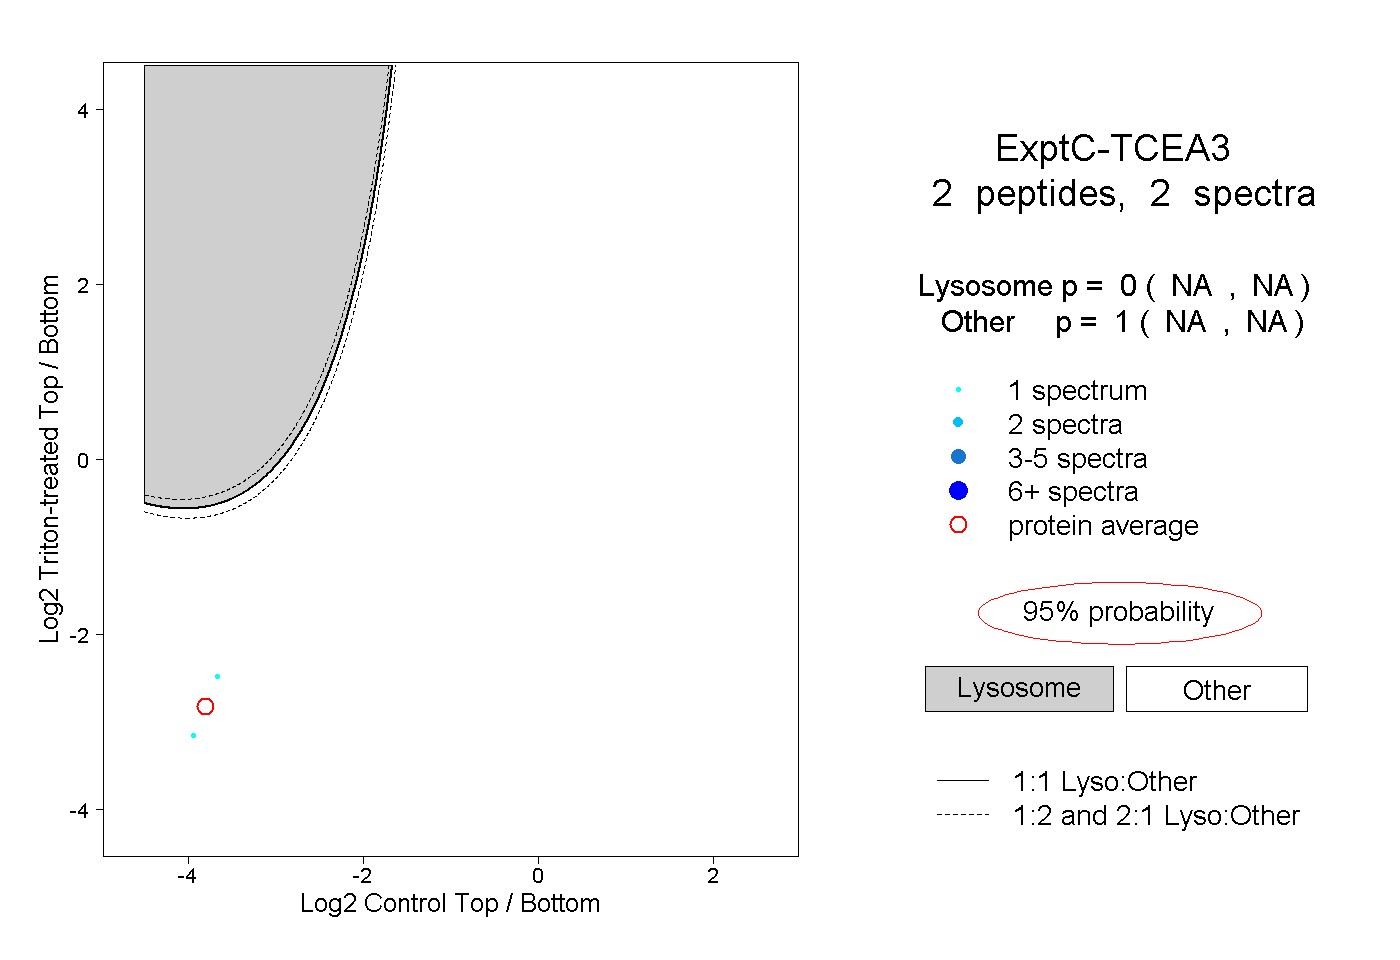
| Plot | Lyso | Other | |||||||||||
| Expt C |
2 peptides |
2 spectra |
|
0.000 NA | NA |
1.000 NA | NA |