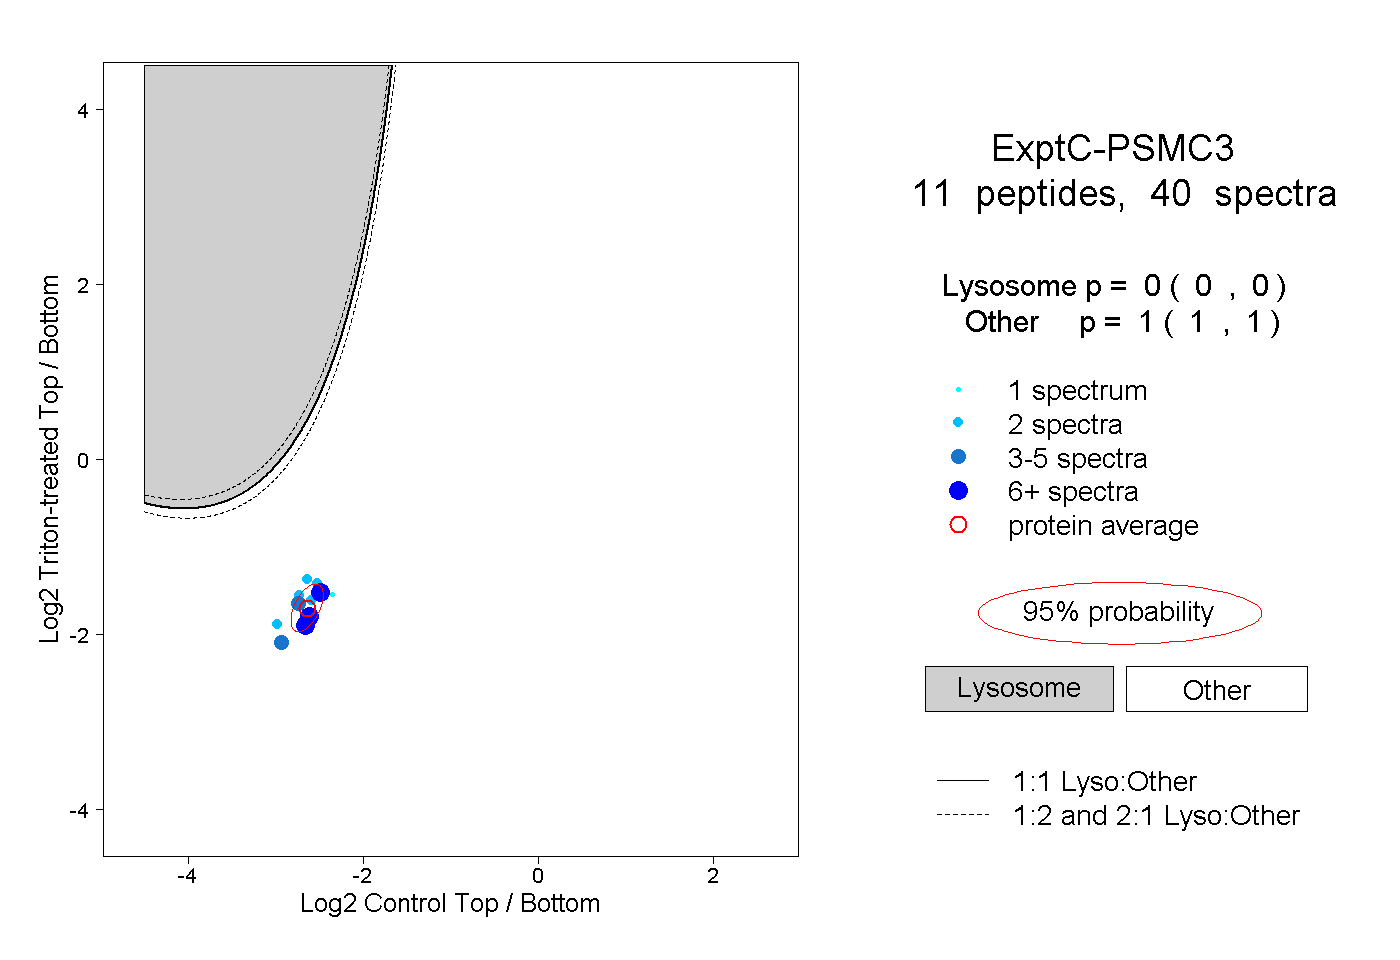
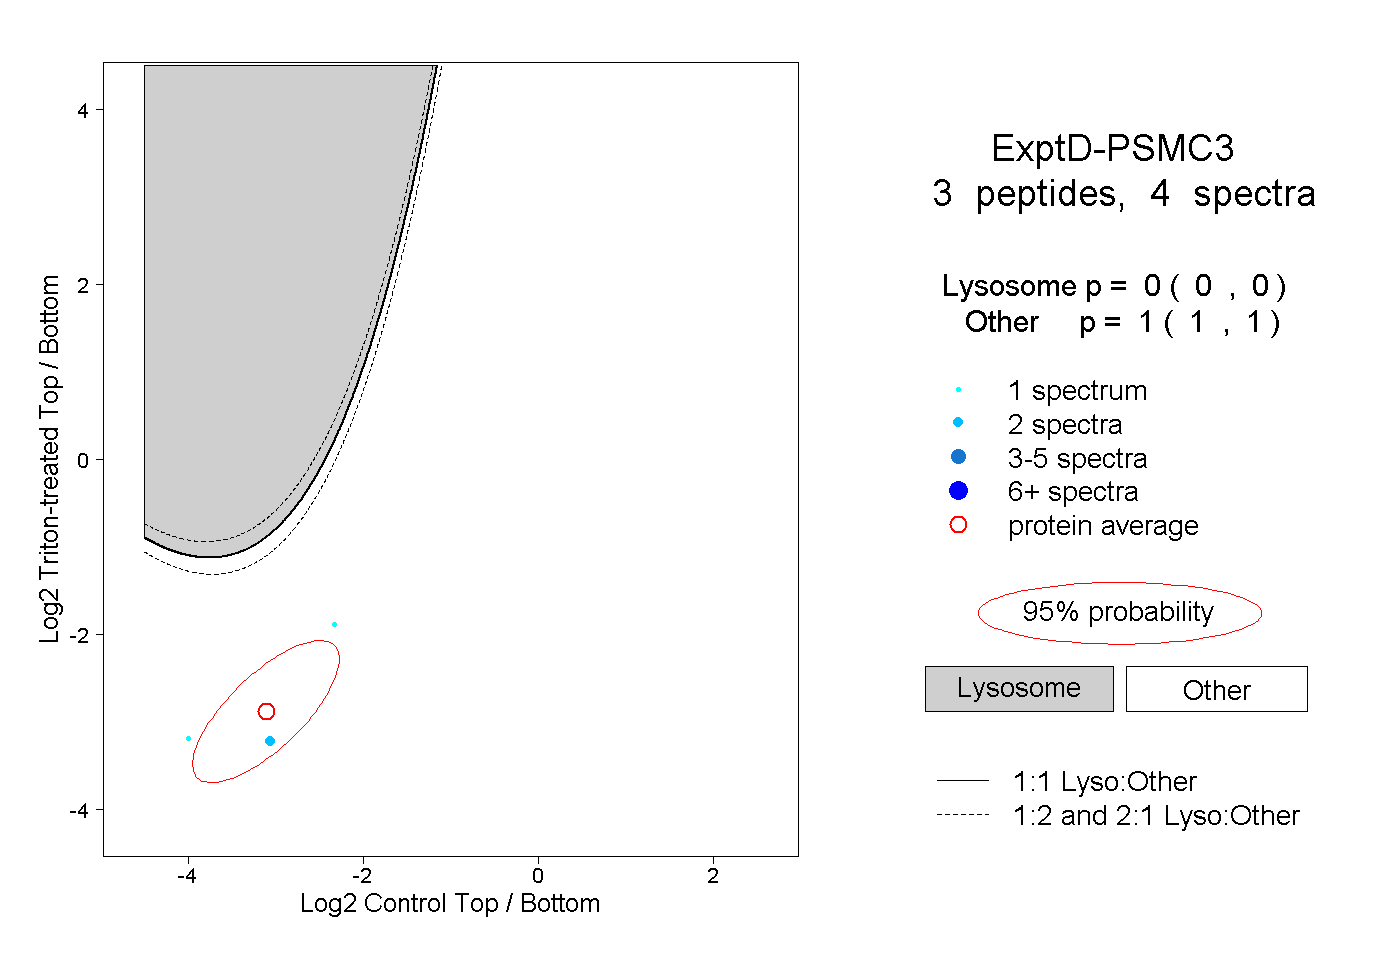
20
20peptides
spectra
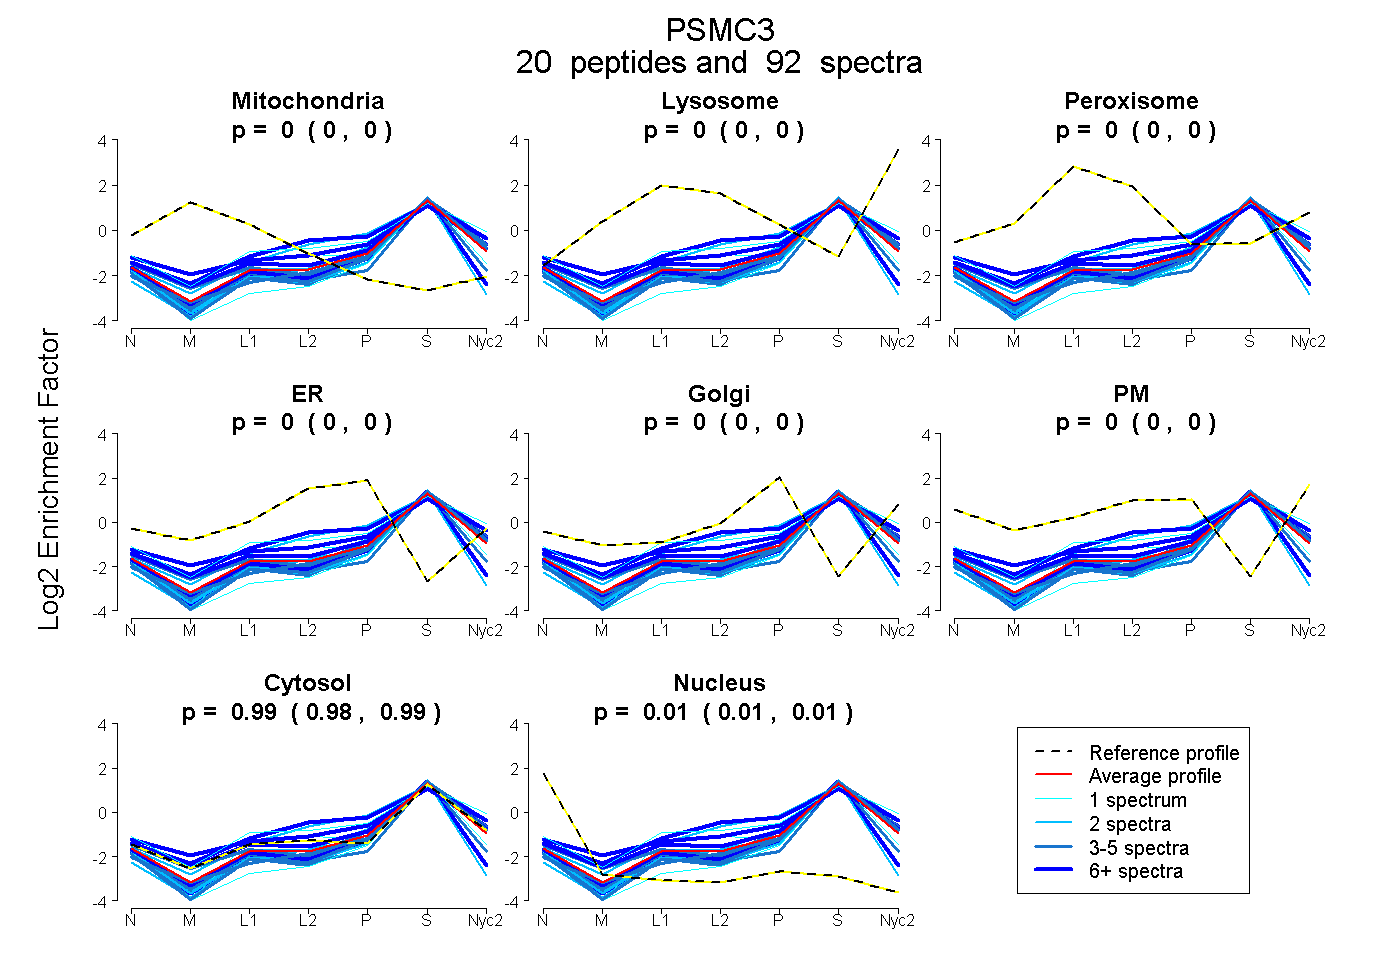
0.000 | 0.000
0.000 | 0.000
0.000 | 0.000
0.000 | 0.000
0.000 | 0.000
0.000 | 0.000
0.985 | 0.990
0.010 | 0.015
6peptides
spectra
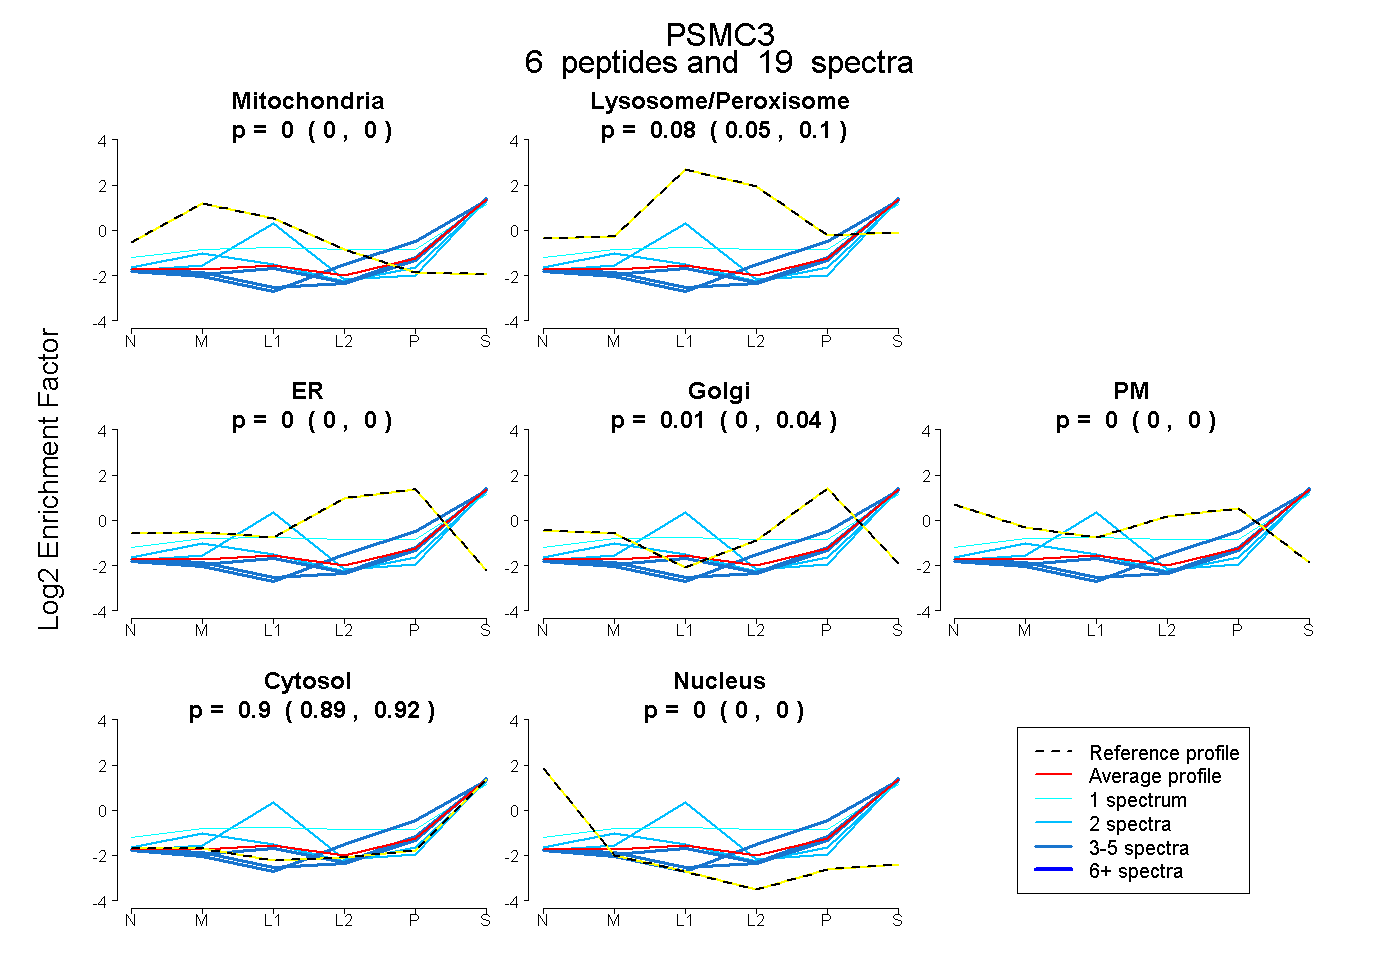
0.000 | 0.000
0.053 | 0.104
0.000 | 0.000
0.000 | 0.035
0.000 | 0.000
0.886 | 0.918
0.000 | 0.000