AGK
[ENSRNOP00000015744]
Main page
| | | Plot |
Mito |
Lyso |
|
Perox |
ER |
Golgi |
PM |
Cytosol |
Nucleus |
|
| Expt A |
 11
11
peptides |
21
spectra |
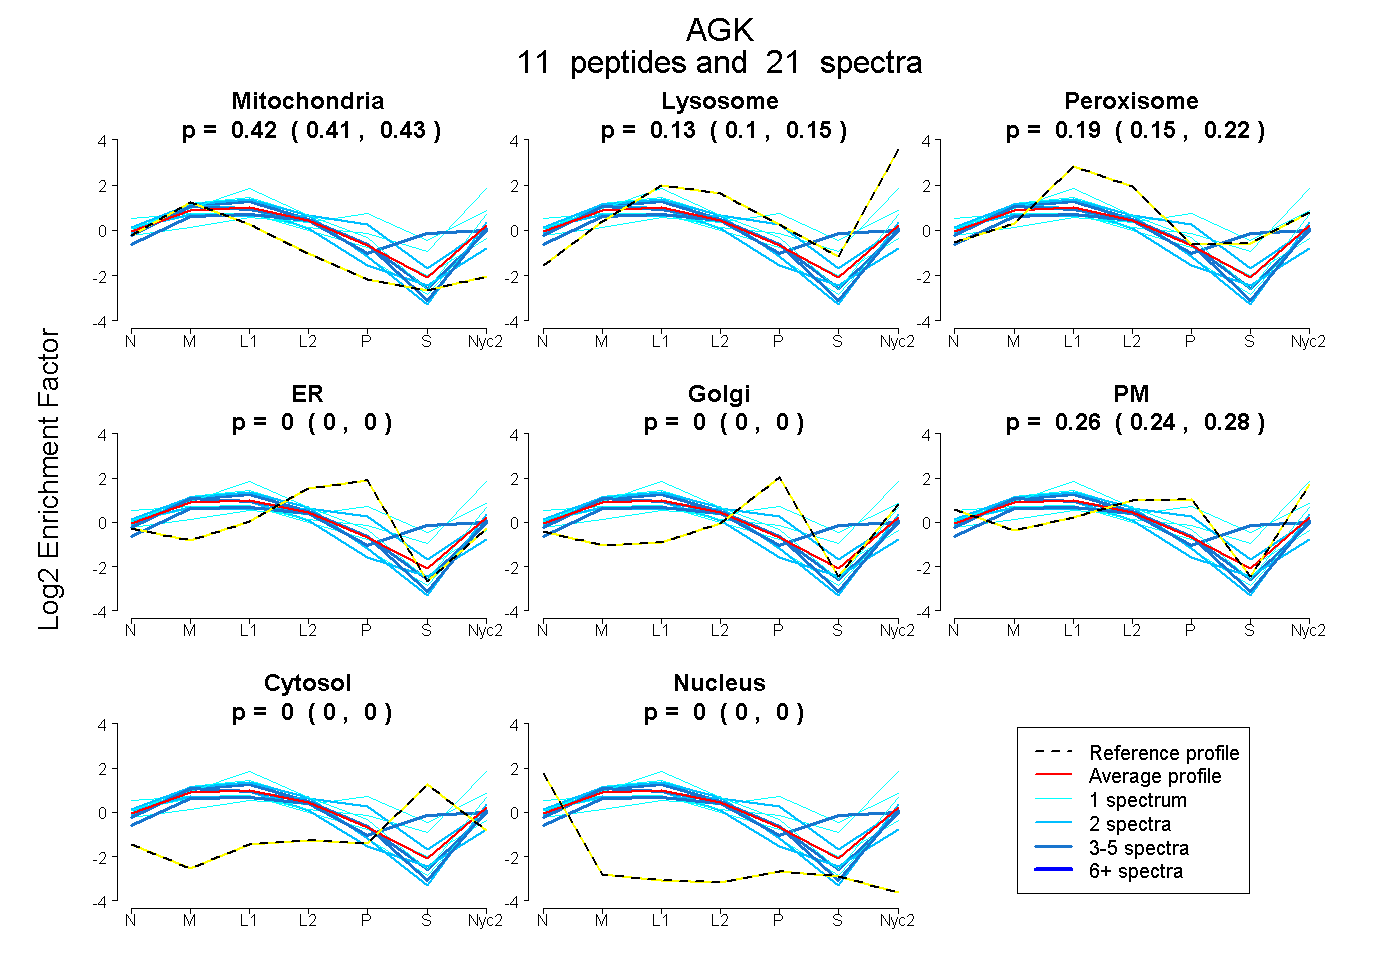 |
0.423
0.409 | 0.435 |
0.127
0.101 | 0.149 |
|
0.188
0.155 | 0.216 |
0.000
0.000 | 0.000 |
0.000
0.000 | 0.000 |
0.262
0.241 | 0.279 |
0.000
0.000 | 0.000 |
0.000
0.000 | 0.000 |
|
| | | Plot |
Mito |
|
Lyso or Perox |
|
ER |
Golgi |
PM |
Cytosol |
Nucleus |
|
| Expt B |
2
peptides |
3
spectra |
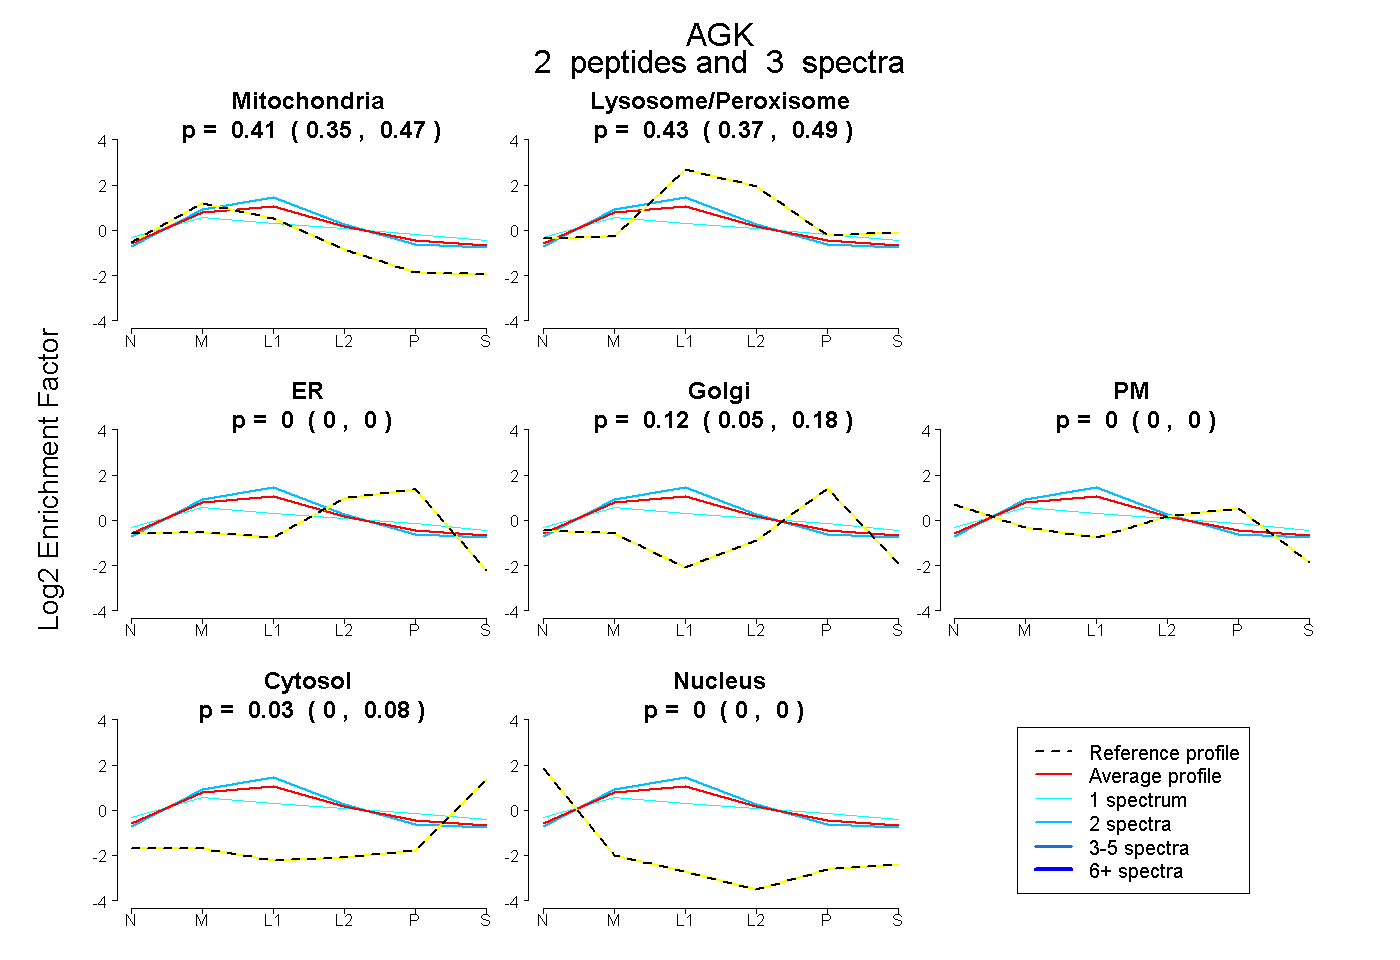 |
0.415
0.352 | 0.466 |
|
0.432
0.366 | 0.486 |
|
0.000
0.000 | 0.000 |
0.120
0.046 | 0.184 |
0.000
0.000 | 0.000 |
0.033
0.000 | 0.076 |
0.000
0.000 | 0.000 |
|
| 2 spectra, VQHVTDAALAIVK |
0.486 |
|
0.456 |
|
0.000 |
0.053 |
0.000 |
0.005 |
0.000 |
|
| 1 spectrum, TDEATFSK |
0.266 |
|
0.373 |
|
0.000 |
0.228 |
0.037 |
0.096 |
0.000 |
|
| | | Plot |
|
Lyso |
|
|
|
|
|
|
|
Other |
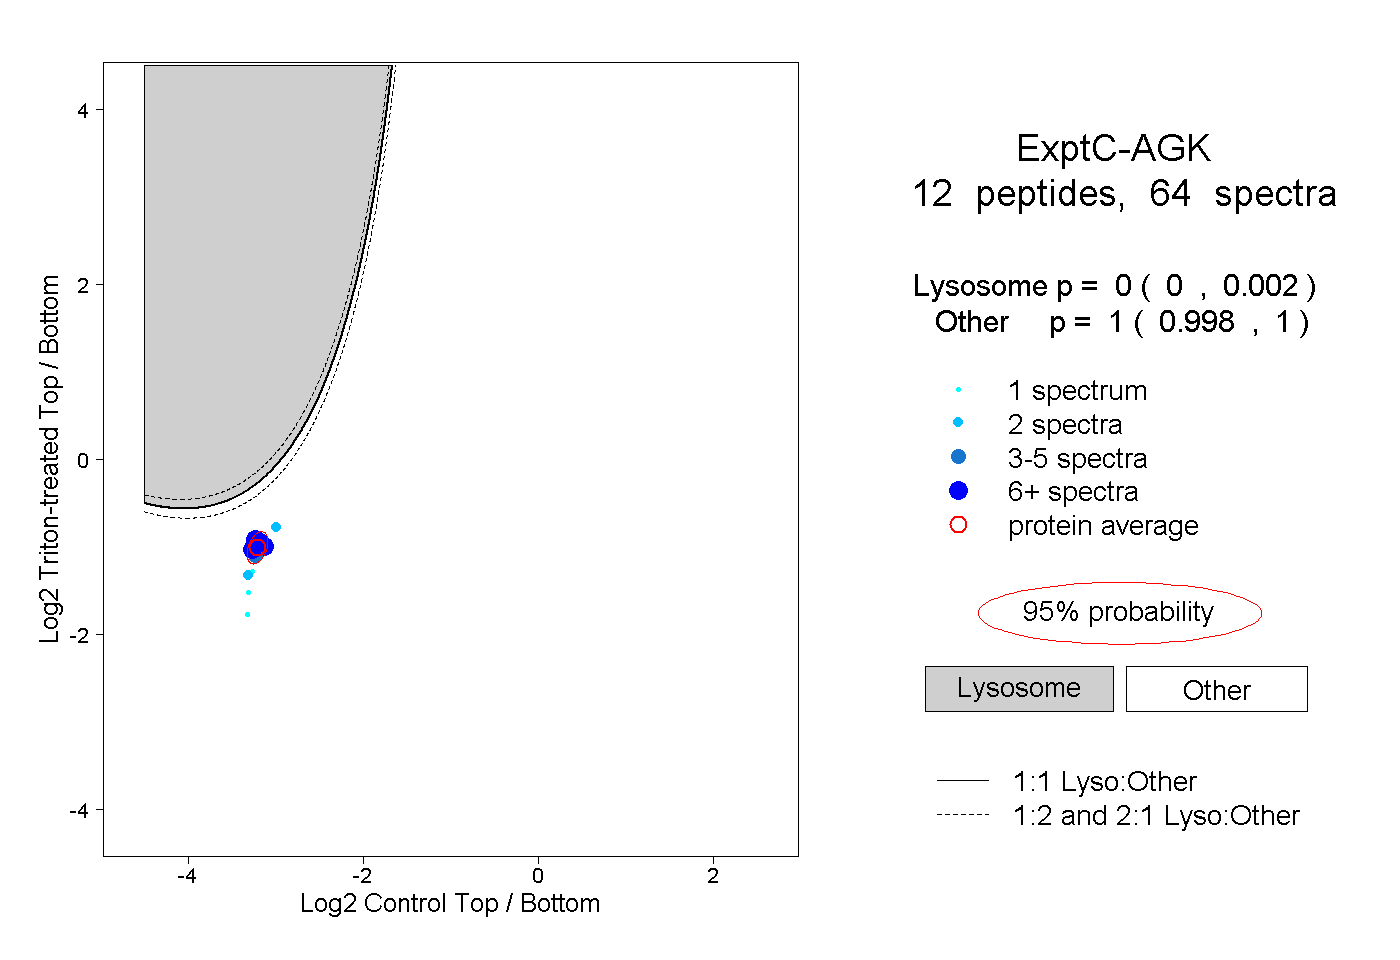
| Expt C |
12
peptides |
64
spectra |
 |
|
0.000
0.000 | 0.002 |
|
|
|
|
|
|
|
1.000
0.998 | 1.000 |
| | | Plot |
|
Lyso |
|
|
|
|
|
|
|
Other |
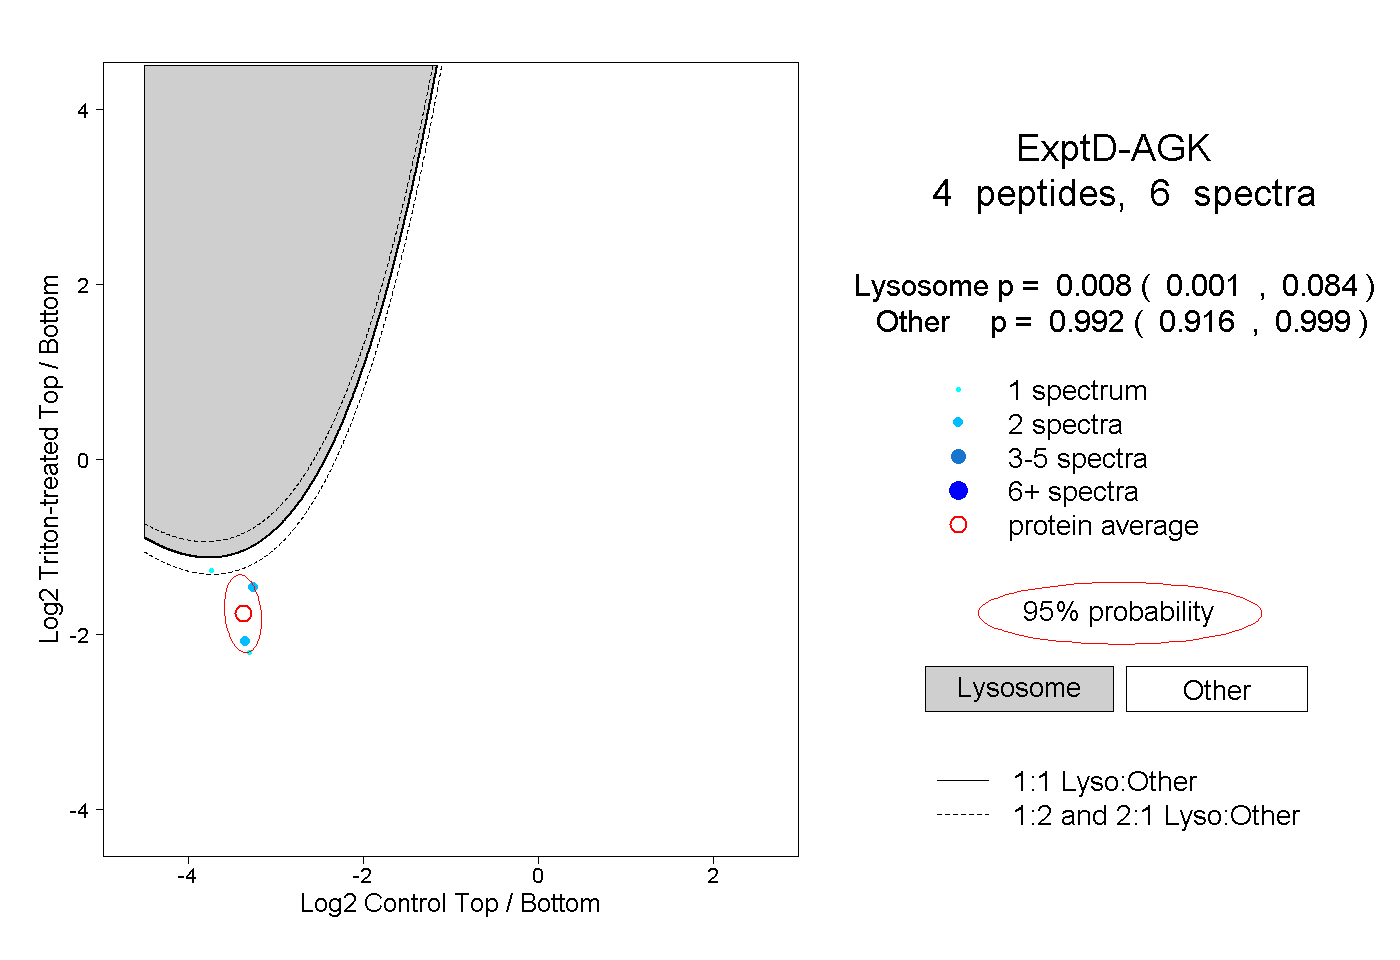
| Expt D |
4
peptides |
6
spectra |
 |
|
0.008
0.001 | 0.084 |
|
|
|
|
|
|
|
0.992
0.916 | 0.999 |