12
12peptides
spectra
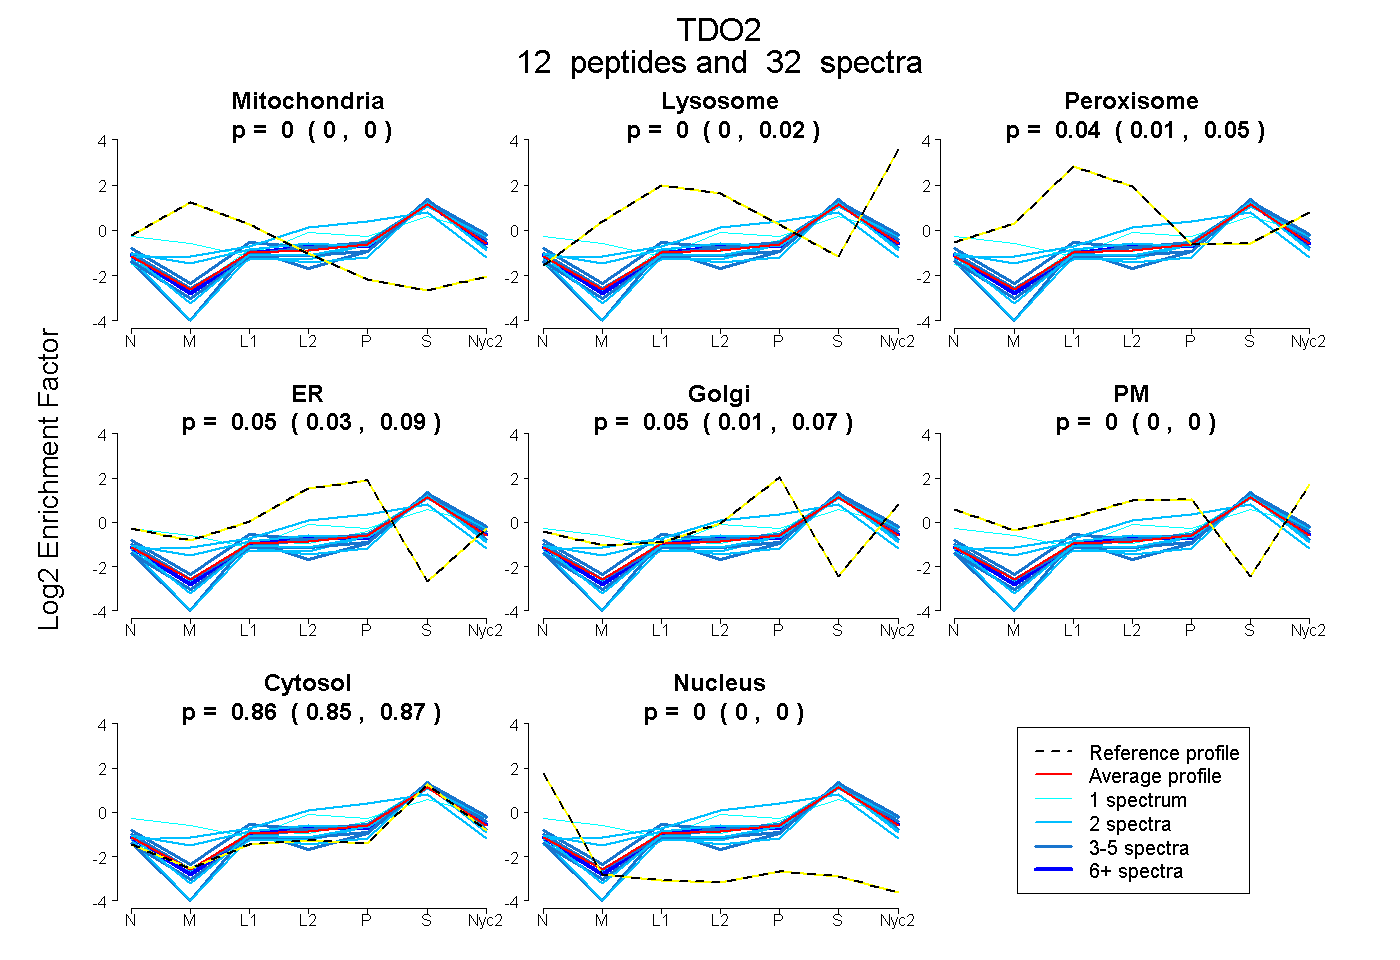
0.000 | 0.000
0.000 | 0.016
0.011 | 0.048
0.029 | 0.091
0.007 | 0.070
0.000 | 0.000
0.846 | 0.866
0.000 | 0.000
8peptides
spectra
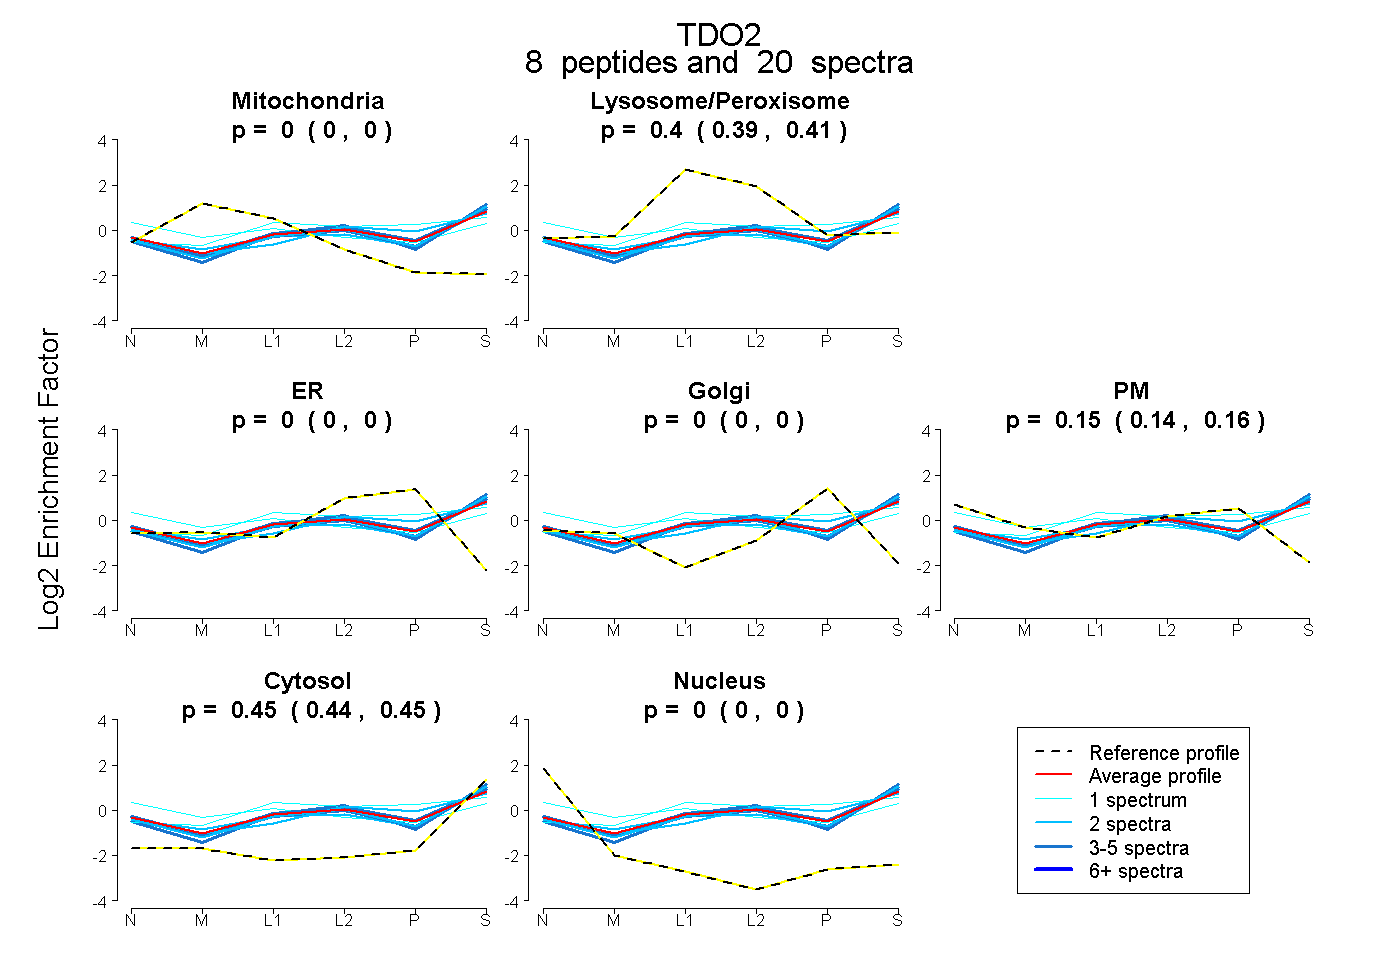
0.000 | 0.000
0.394 | 0.408
0.000 | 0.000
0.000 | 0.000
0.140 | 0.162
0.438 | 0.452
0.000 | 0.000