 12
12peptides
spectra
0.000 | 0.000
0.000 | 0.016
0.011 | 0.048
0.029 | 0.091
0.007 | 0.070
0.000 | 0.000
0.846 | 0.866
0.000 | 0.000
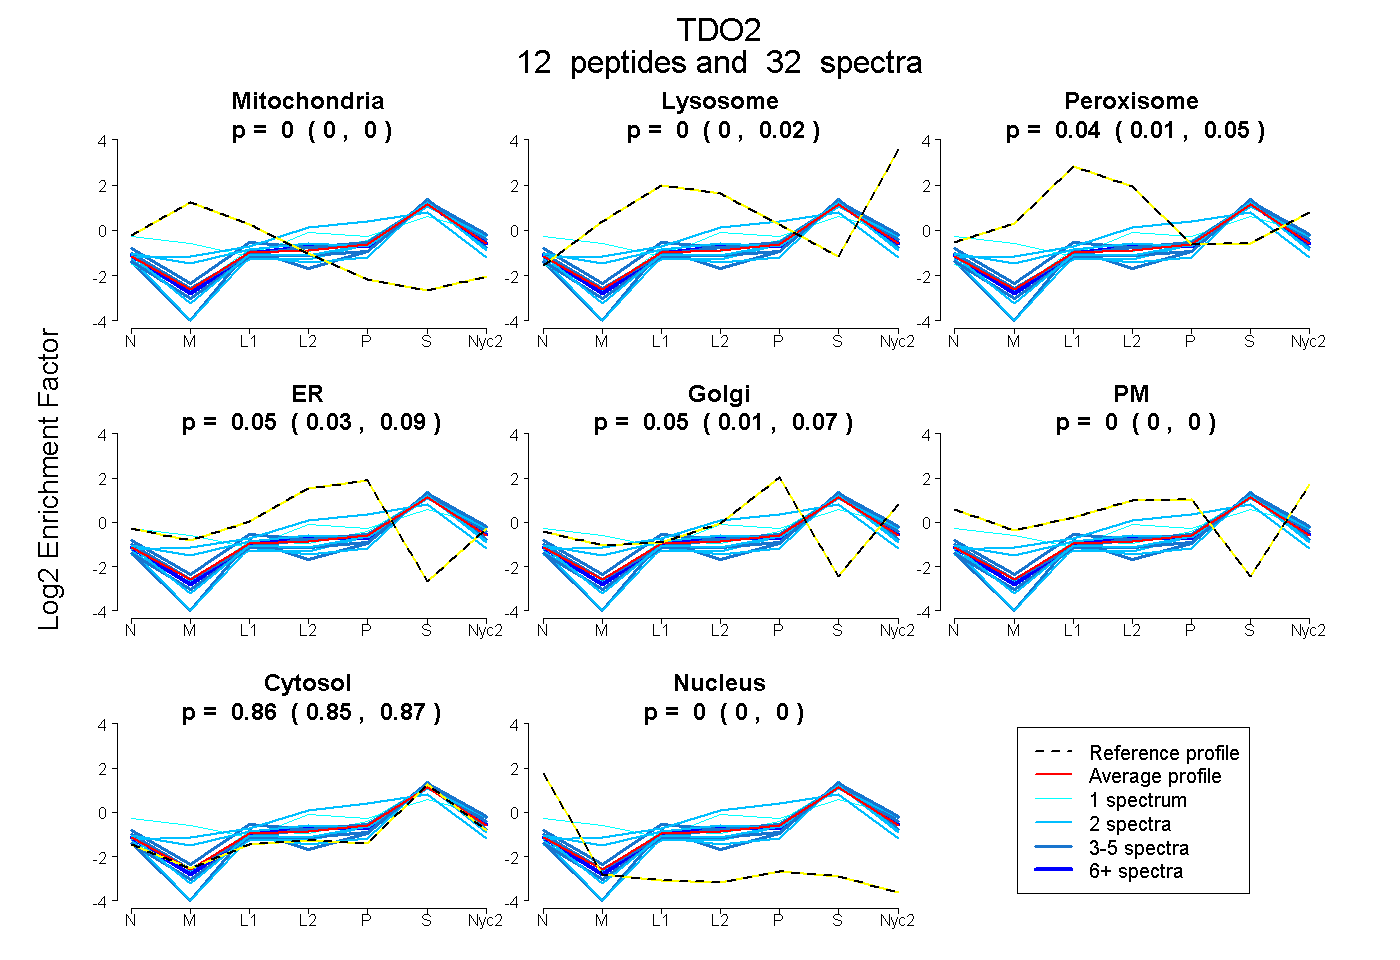
| Plot | Mito | Lyso | Perox | ER | Golgi | PM | Cytosol | Nucleus | |||||
| Expt A |
12 peptides |
32 spectra |
|
0.000 0.000 | 0.000 |
0.000 0.000 | 0.016 |
0.039 0.011 | 0.048 |
0.053 0.029 | 0.091 |
0.052 0.007 | 0.070 |
0.000 0.000 | 0.000 |
0.855 0.846 | 0.866 |
0.000 0.000 | 0.000 |
| 2 spectra, EYLSPASGFQSLQFR | 0.000 | 0.000 | 0.000 | 0.000 | 0.000 | 0.000 | 0.994 | 0.006 | ||
| 2 spectra, TPGLEPHGFNFWGK | 0.000 | 0.000 | 0.000 | 0.067 | 0.000 | 0.000 | 0.933 | 0.000 | ||
| 3 spectra, ILNAQELQSEIK | 0.000 | 0.010 | 0.107 | 0.000 | 0.004 | 0.093 | 0.786 | 0.000 | ||
| 2 spectra, MNPIIHK | 0.000 | 0.049 | 0.123 | 0.000 | 0.054 | 0.027 | 0.747 | 0.000 | ||
| 1 spectrum, EIFQNGHVR | 0.040 | 0.000 | 0.061 | 0.000 | 0.000 | 0.316 | 0.583 | 0.000 | ||
| 2 spectra, GGLIYGDYLQLEK | 0.000 | 0.000 | 0.000 | 0.000 | 0.075 | 0.000 | 0.925 | 0.000 | ||
| 2 spectra, VVVIFK | 0.000 | 0.000 | 0.081 | 0.303 | 0.000 | 0.000 | 0.615 | 0.000 | ||
| 4 spectra, AGTGGSSGYYYLR | 0.000 | 0.000 | 0.000 | 0.000 | 0.000 | 0.000 | 1.000 | 0.000 | ||
| 1 spectrum, DNFEGDYNELLLK | 0.000 | 0.061 | 0.000 | 0.032 | 0.044 | 0.000 | 0.863 | 0.000 | ||
| 3 spectra, QILWELDSVR | 0.000 | 0.054 | 0.000 | 0.000 | 0.016 | 0.000 | 0.930 | 0.000 | ||
| 6 spectra, GLEEEFLK | 0.000 | 0.011 | 0.020 | 0.089 | 0.000 | 0.000 | 0.879 | 0.000 | ||
| 4 spectra, IGVLQSLR | 0.000 | 0.024 | 0.000 | 0.053 | 0.034 | 0.039 | 0.850 | 0.000 |
| Plot | Mito | Lyso or Perox | ER | Golgi | PM | Cytosol | Nucleus | ||||||
| Expt B |
8 peptides |
20 spectra |
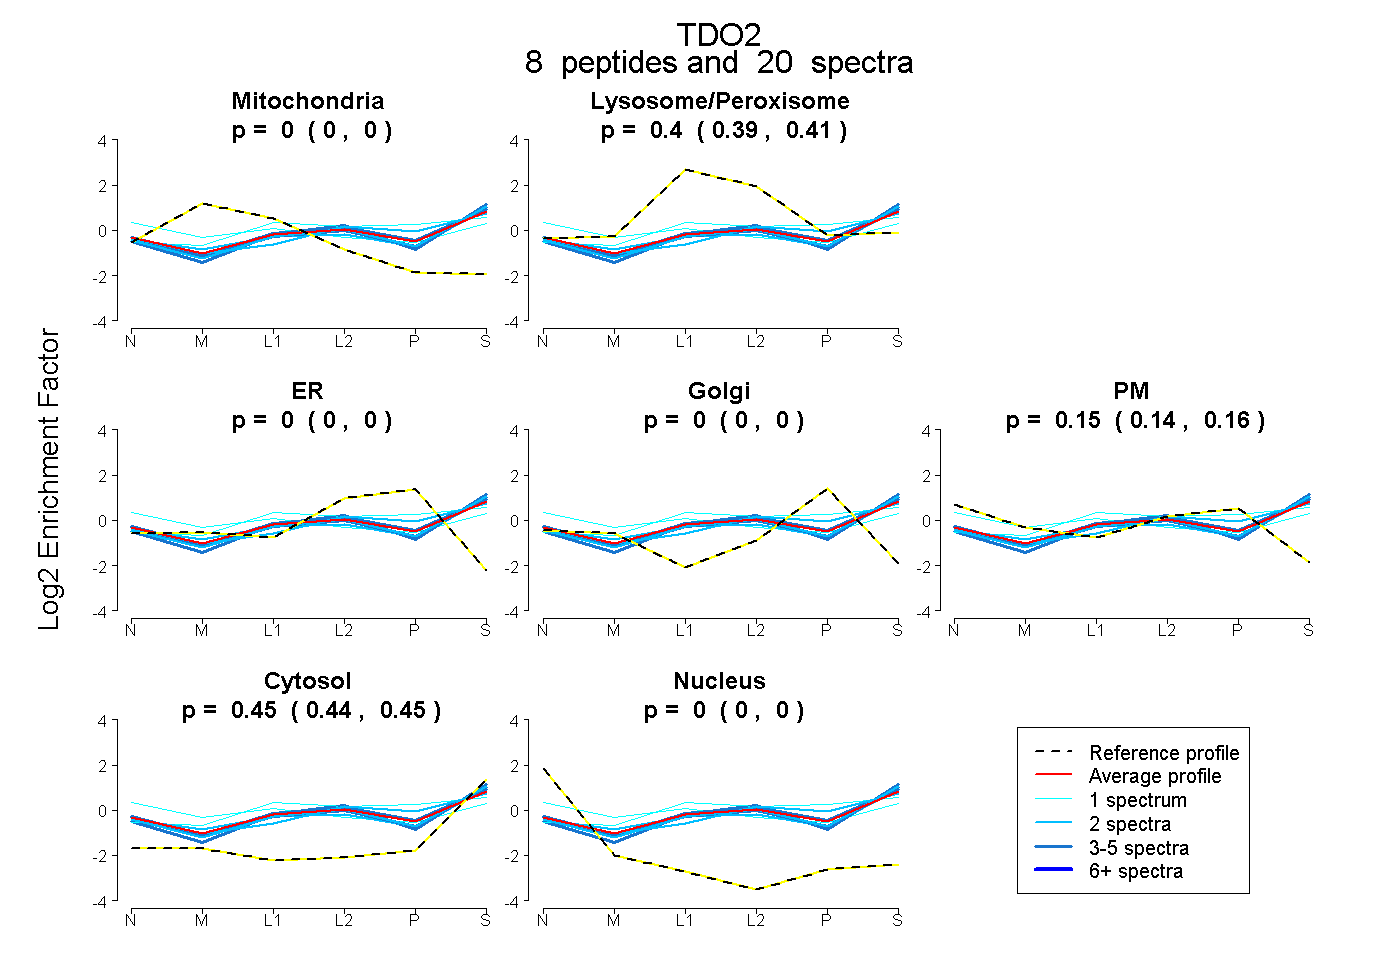 |
0.000 0.000 | 0.000 |
0.402 0.394 | 0.408 |
0.000 0.000 | 0.000 |
0.000 0.000 | 0.000 |
0.153 0.140 | 0.162 |
0.446 0.438 | 0.452 |
0.000 0.000 | 0.000 |
|||
| Plot | Lyso | Other | |||||||||||
| Expt C |
11 peptides |
34 spectra |
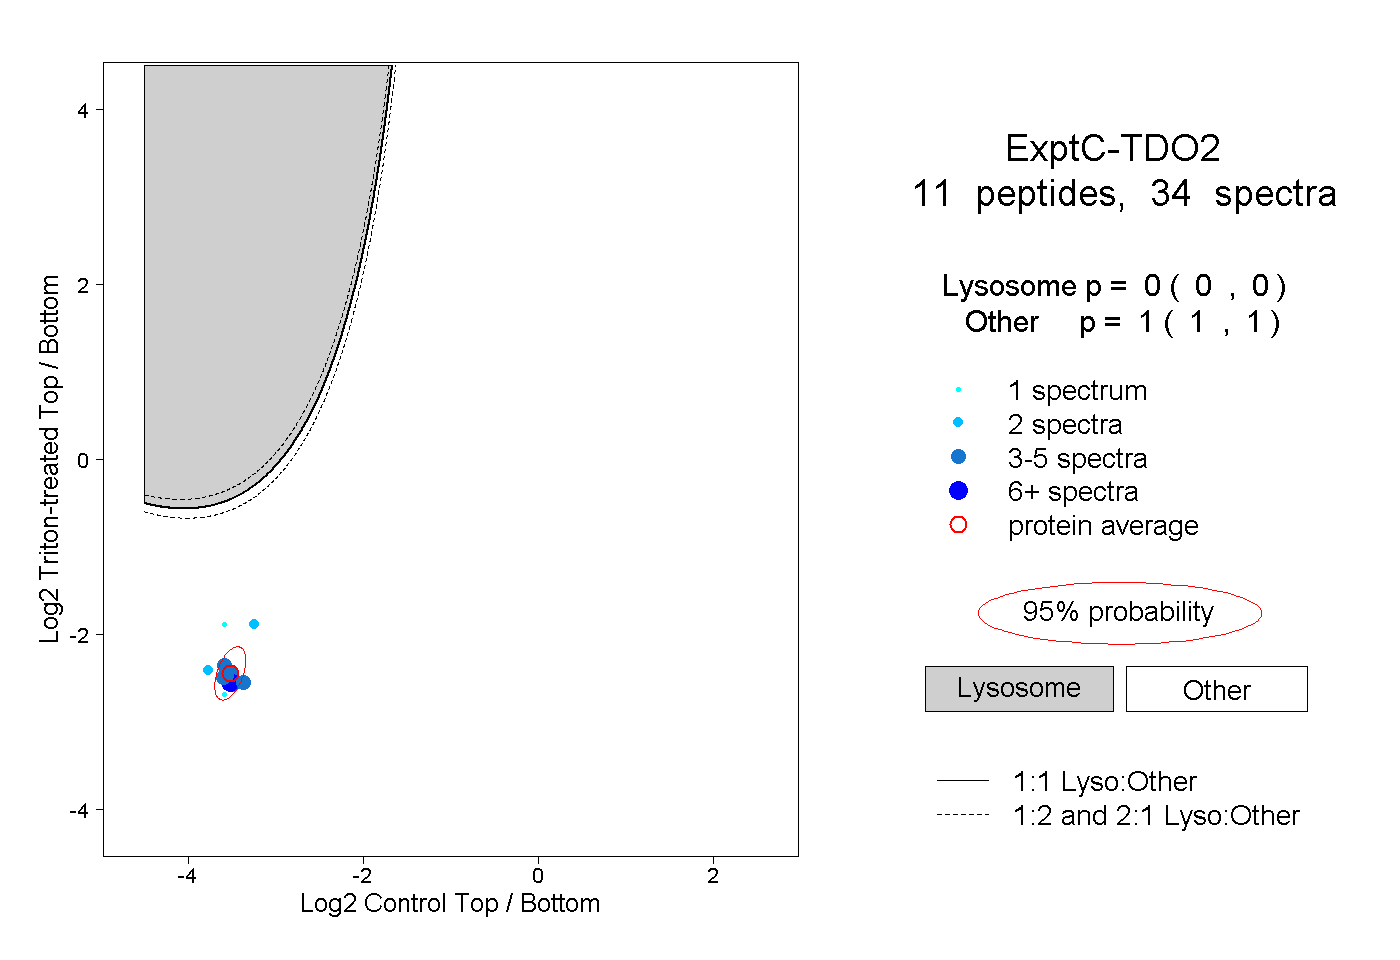 |
0.000 0.000 | 0.000 |
1.000 1.000 | 1.000 |
||||||||
| Plot | Lyso | Other | |||||||||||
| Expt D |
3 peptides |
9 spectra |
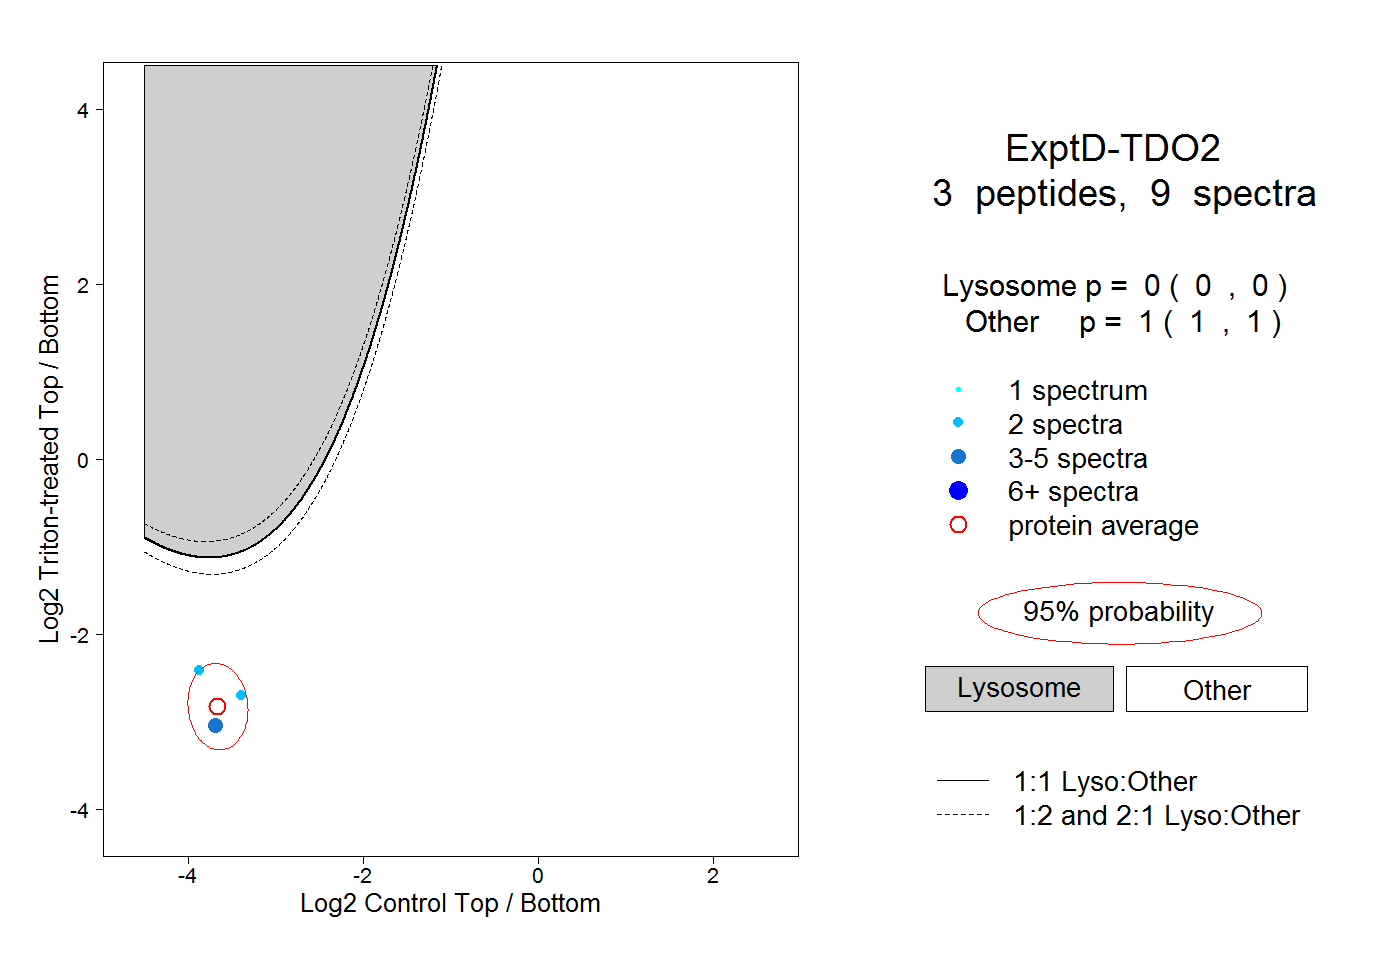 |
0.000 0.000 | 0.000 |
1.000 1.000 | 1.000 |