 3
3peptides
spectra
0.000 | 0.000
0.000 | 0.059
0.258 | 0.330
0.132 | 0.266
0.000 | 0.000
0.277 | 0.420
0.096 | 0.128
0.000 | 0.000
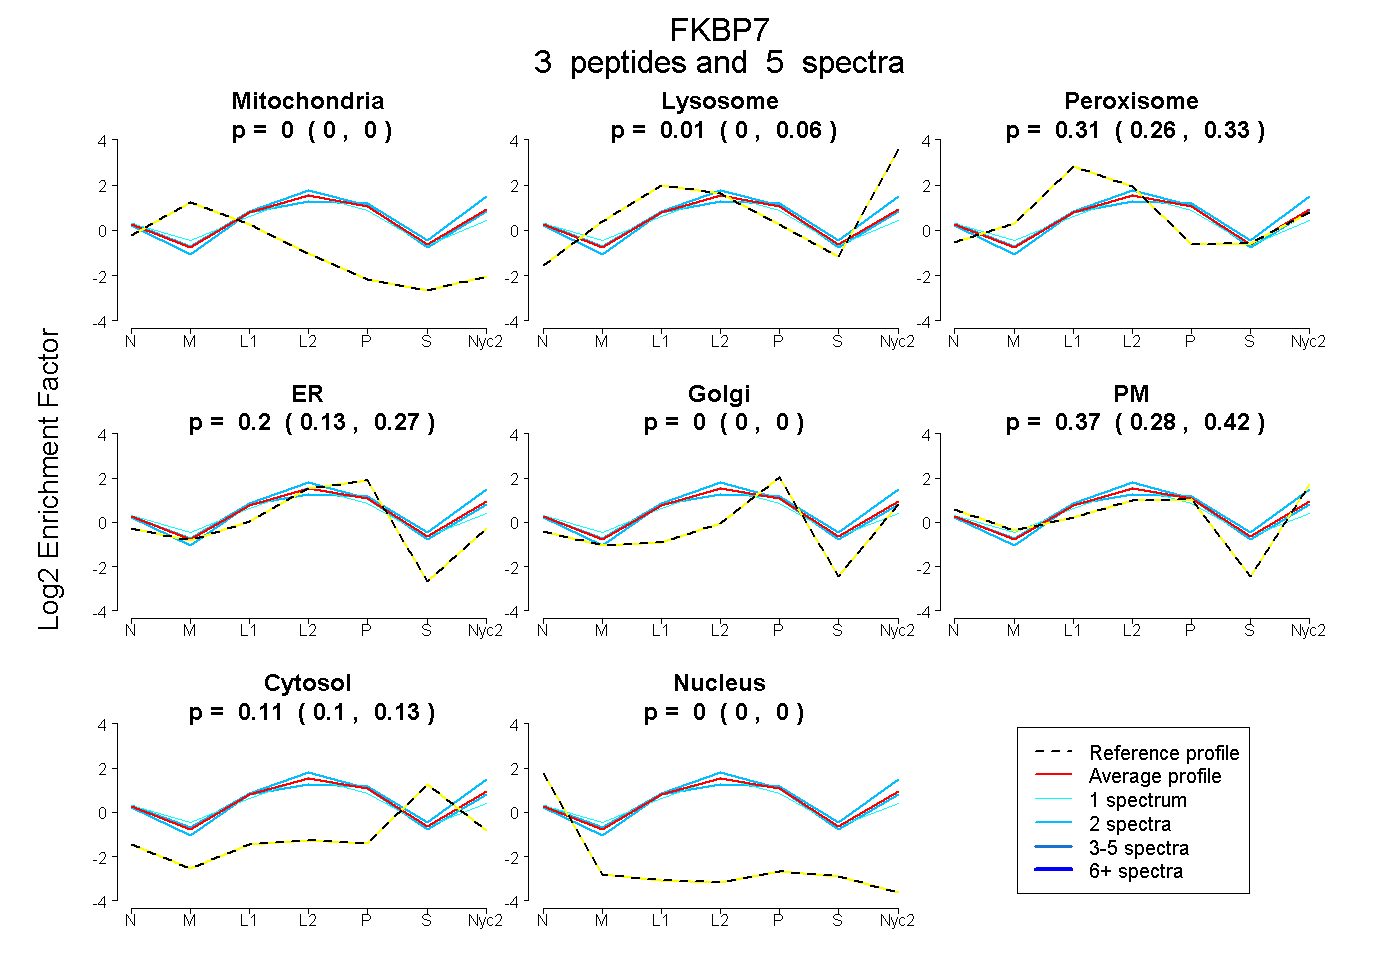
| Plot | Mito | Lyso | Perox | ER | Golgi | PM | Cytosol | Nucleus | |||||
| Expt A |
3 peptides |
5 spectra |
|
0.000 0.000 | 0.000 |
0.009 0.000 | 0.059 |
0.310 0.258 | 0.330 |
0.199 0.132 | 0.266 |
0.000 0.000 | 0.000 |
0.369 0.277 | 0.420 |
0.113 0.096 | 0.128 |
0.000 0.000 | 0.000 |
| 1 spectrum, TQDEGHPK | 0.000 | 0.000 | 0.337 | 0.303 | 0.000 | 0.235 | 0.125 | 0.000 | ||
| 2 spectra, QIDTDNDR | 0.000 | 0.000 | 0.341 | 0.273 | 0.000 | 0.313 | 0.074 | 0.000 | ||
| 2 spectra, EYNVHQHDEL | 0.000 | 0.155 | 0.161 | 0.091 | 0.000 | 0.439 | 0.154 | 0.000 |
| Plot | Lyso | Other | |||||||||||
| Expt C |
3 peptides |
4 spectra |
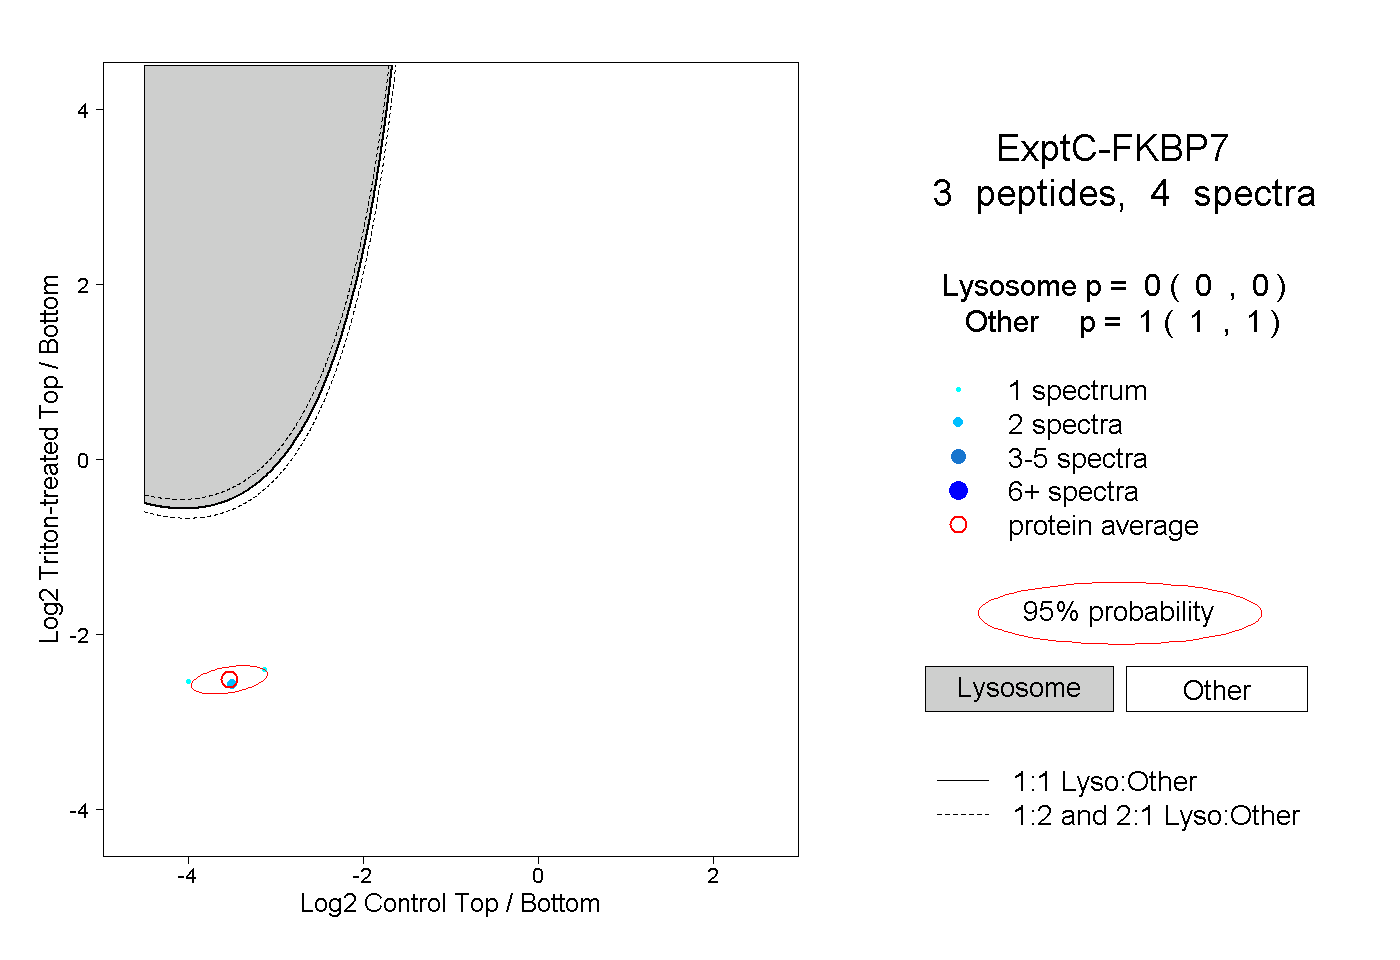 |
0.000 0.000 | 0.000 |
1.000 1.000 | 1.000 |
||||||||
| Plot | Lyso | Other | |||||||||||
| Expt D |
1 peptide |
2 spectra |
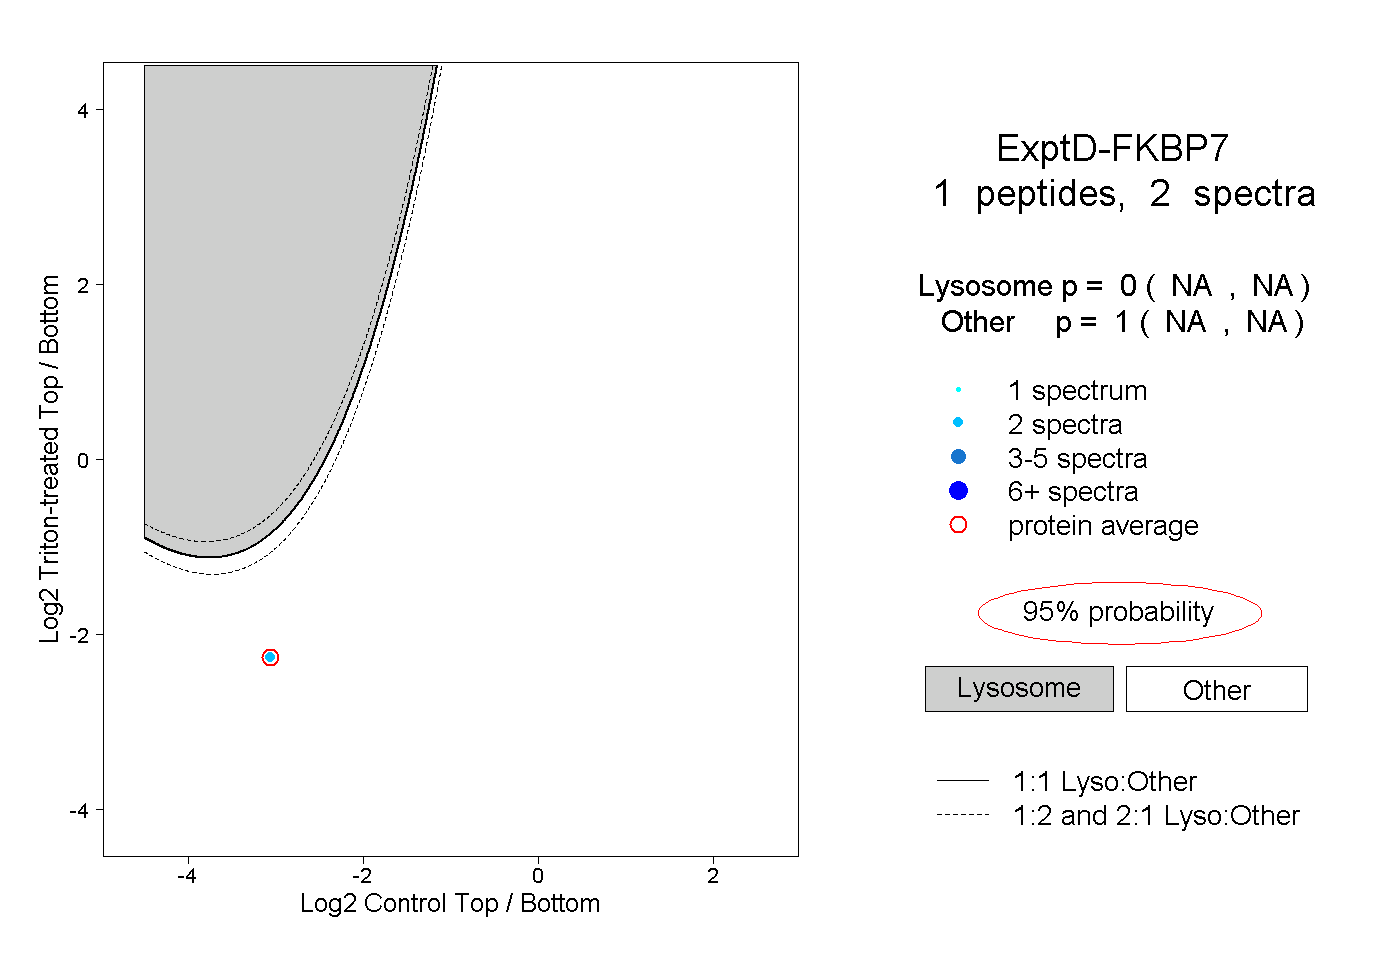 |
0.000 NA | NA |
1.000 NA | NA |