 3
3peptides
spectra
0.000 | 0.000
0.000 | 0.177
0.000 | 0.146
0.000 | 0.158
0.000 | 0.124
0.000 | 0.419
0.493 | 0.593
0.000 | 0.000
1peptide
spectrum
NA | NA
NA | NA
NA | NA
NA | NA
NA | NA
NA | NA
NA | NA
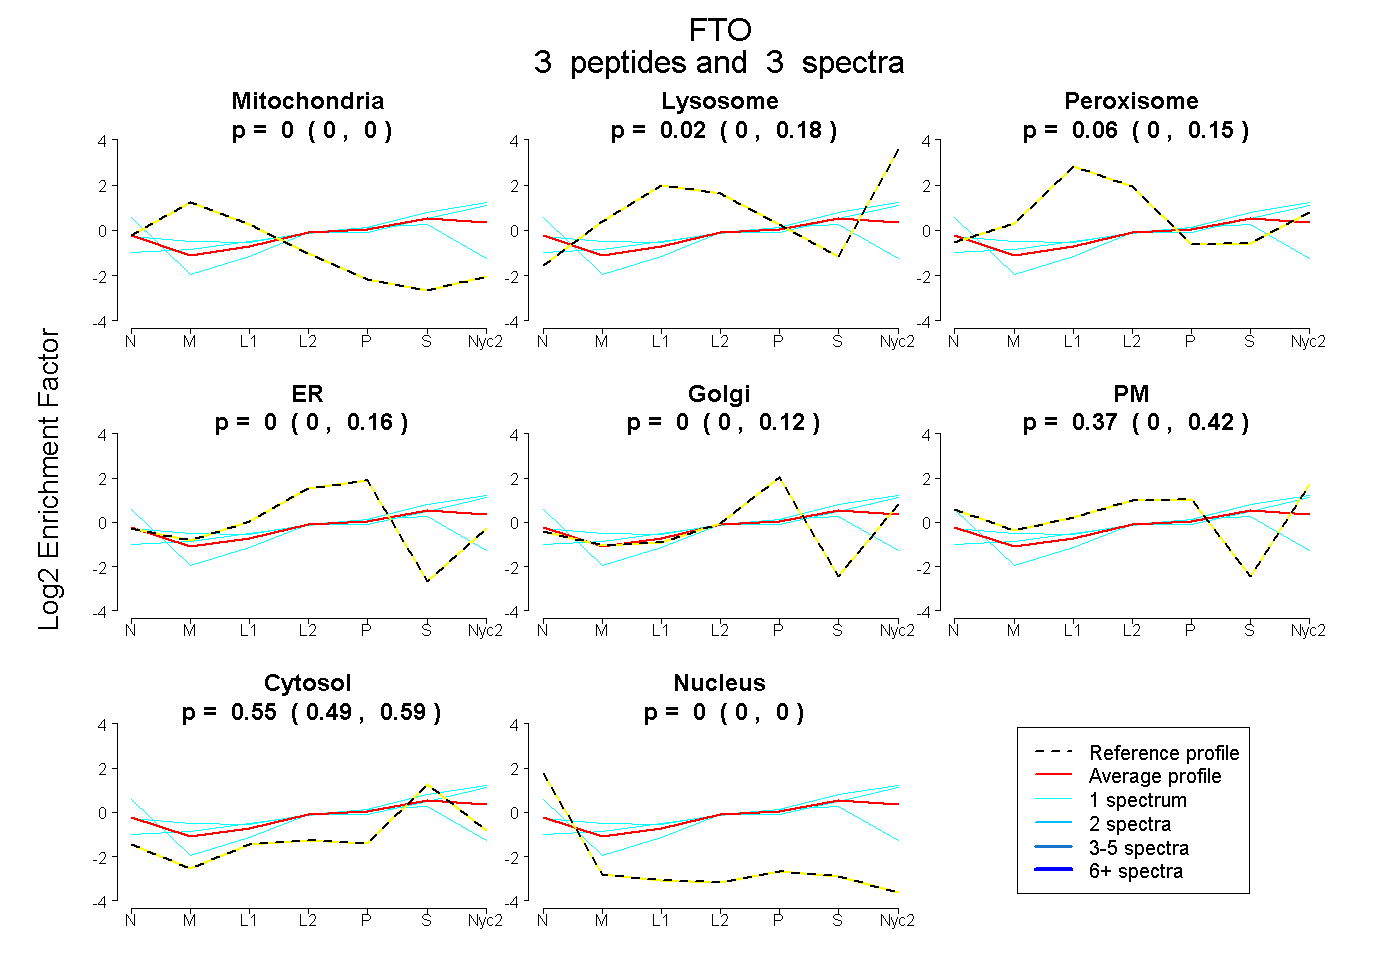
| Plot | Mito | Lyso | Perox | ER | Golgi | PM | Cytosol | Nucleus | |||||
| Expt A |
3 peptides |
3 spectra |
|
0.000 0.000 | 0.000 |
0.016 0.000 | 0.177 |
0.062 0.000 | 0.146 |
0.000 0.000 | 0.158 |
0.000 0.000 | 0.124 |
0.369 0.000 | 0.419 |
0.553 0.493 | 0.593 |
0.000 0.000 | 0.000 |
||
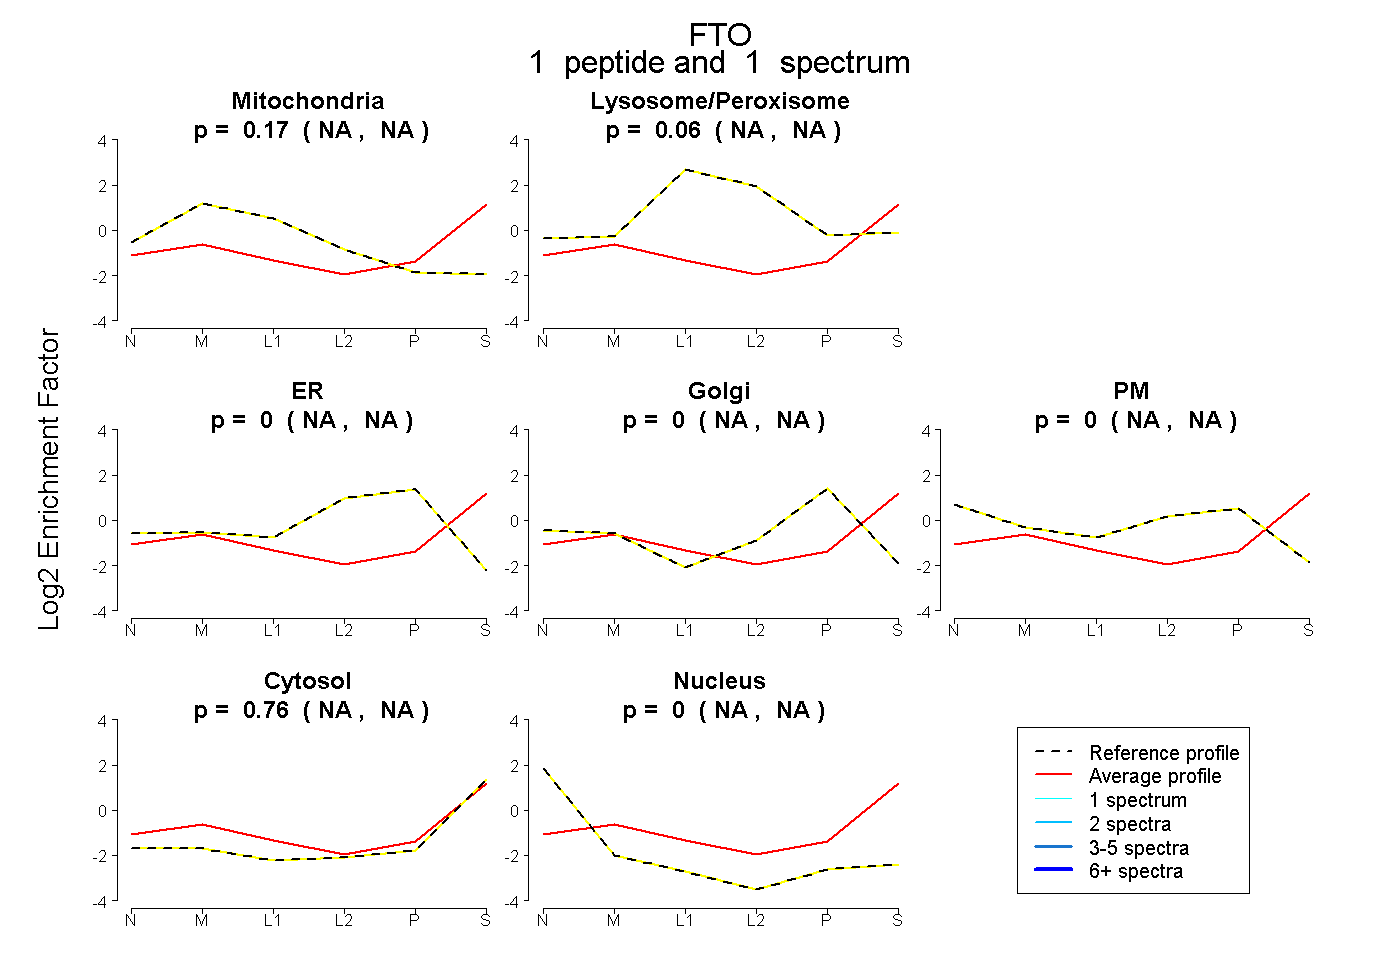
| Plot | Mito | Lyso or Perox | ER | Golgi | PM | Cytosol | Nucleus | ||||||
| Expt B |
1 peptide |
1 spectrum |
|
0.169 NA | NA |
0.063 NA | NA |
0.000 NA | NA |
0.000 NA | NA |
0.004 NA | NA |
0.764 NA | NA |
0.000 NA | NA |