 2
2peptides
spectra
0.000 | 0.213
0.140 | 0.465
0.000 | 0.706
0.000 | 0.268
0.000 | 0.171
0.000 | 0.174
0.000 | 0.157
0.000 | 0.010
2peptides
spectra
0.000 | 0.000
1.000 | 1.000
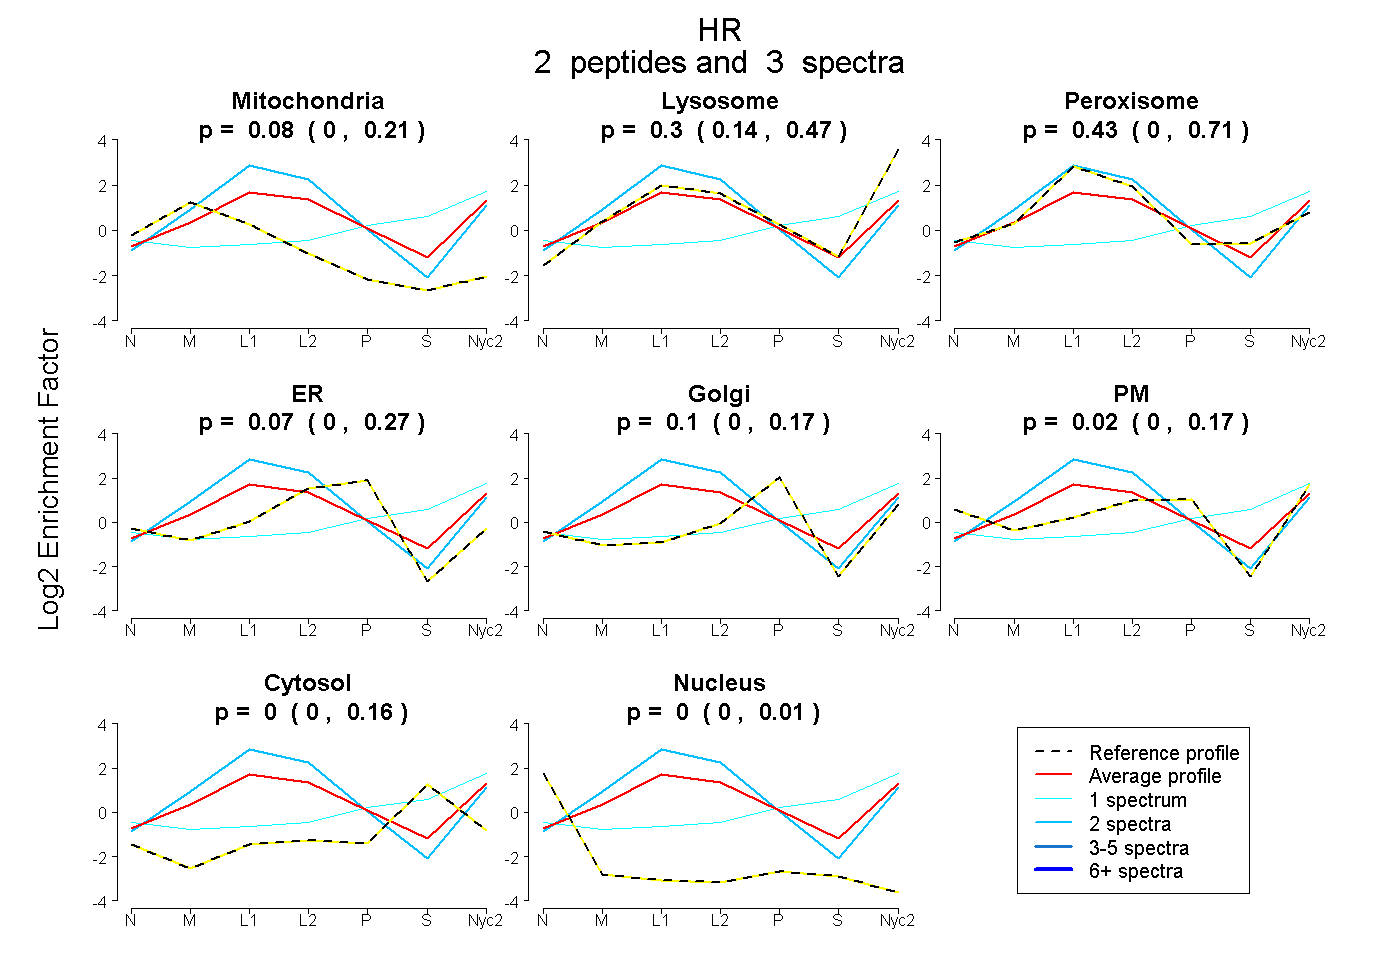
| Plot | Mito | Lyso | Perox | ER | Golgi | PM | Cytosol | Nucleus | |||||
| Expt A |
2 peptides |
3 spectra |
|
0.084 0.000 | 0.213 |
0.304 0.140 | 0.465 |
0.426 0.000 | 0.706 |
0.066 0.000 | 0.268 |
0.103 0.000 | 0.171 |
0.017 0.000 | 0.174 |
0.000 0.000 | 0.157 |
0.000 0.000 | 0.010 |
||
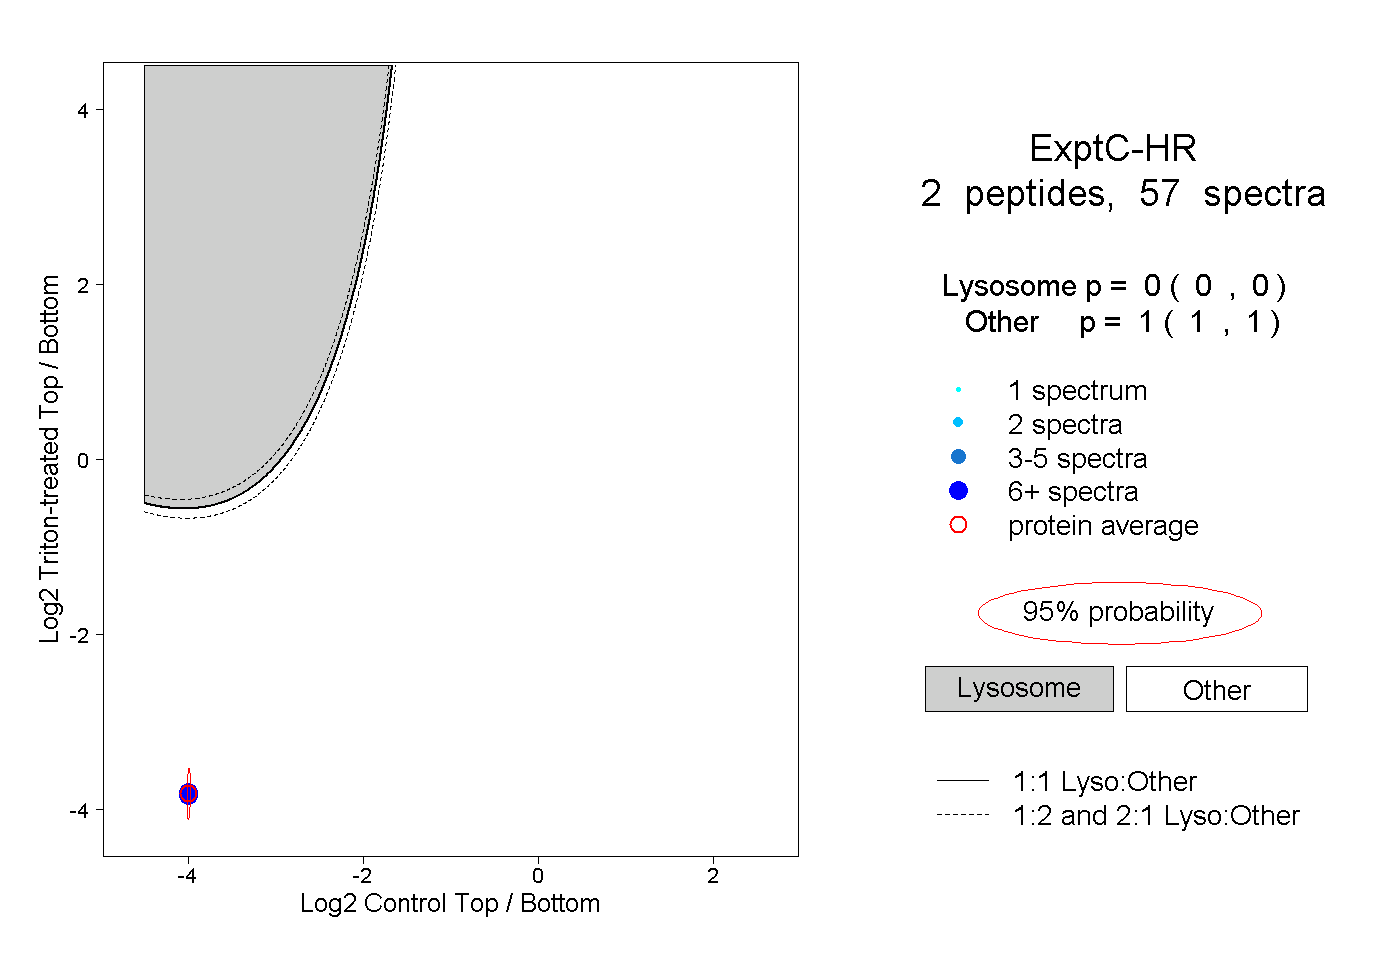
| Plot | Lyso | Other | |||||||||||
| Expt C |
2 peptides |
57 spectra |
|
0.000 0.000 | 0.000 |
1.000 1.000 | 1.000 |