 5
5peptides
spectra
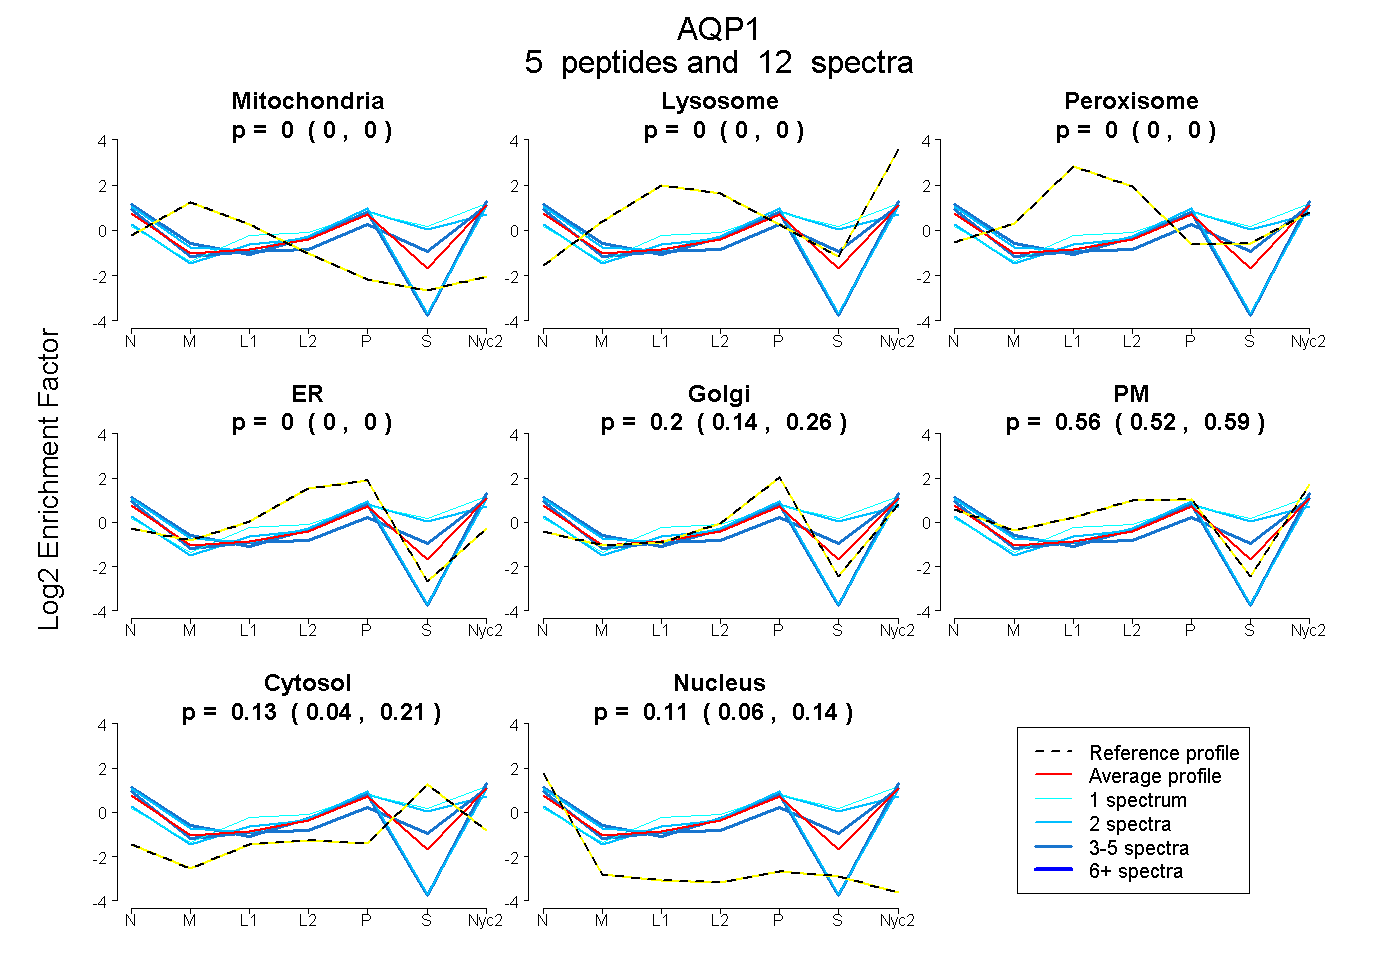
0.000 | 0.000
0.000 | 0.000
0.000 | 0.000
0.000 | 0.000
0.142 | 0.258
0.522 | 0.587
0.044 | 0.205
0.064 | 0.143
2peptides
spectra
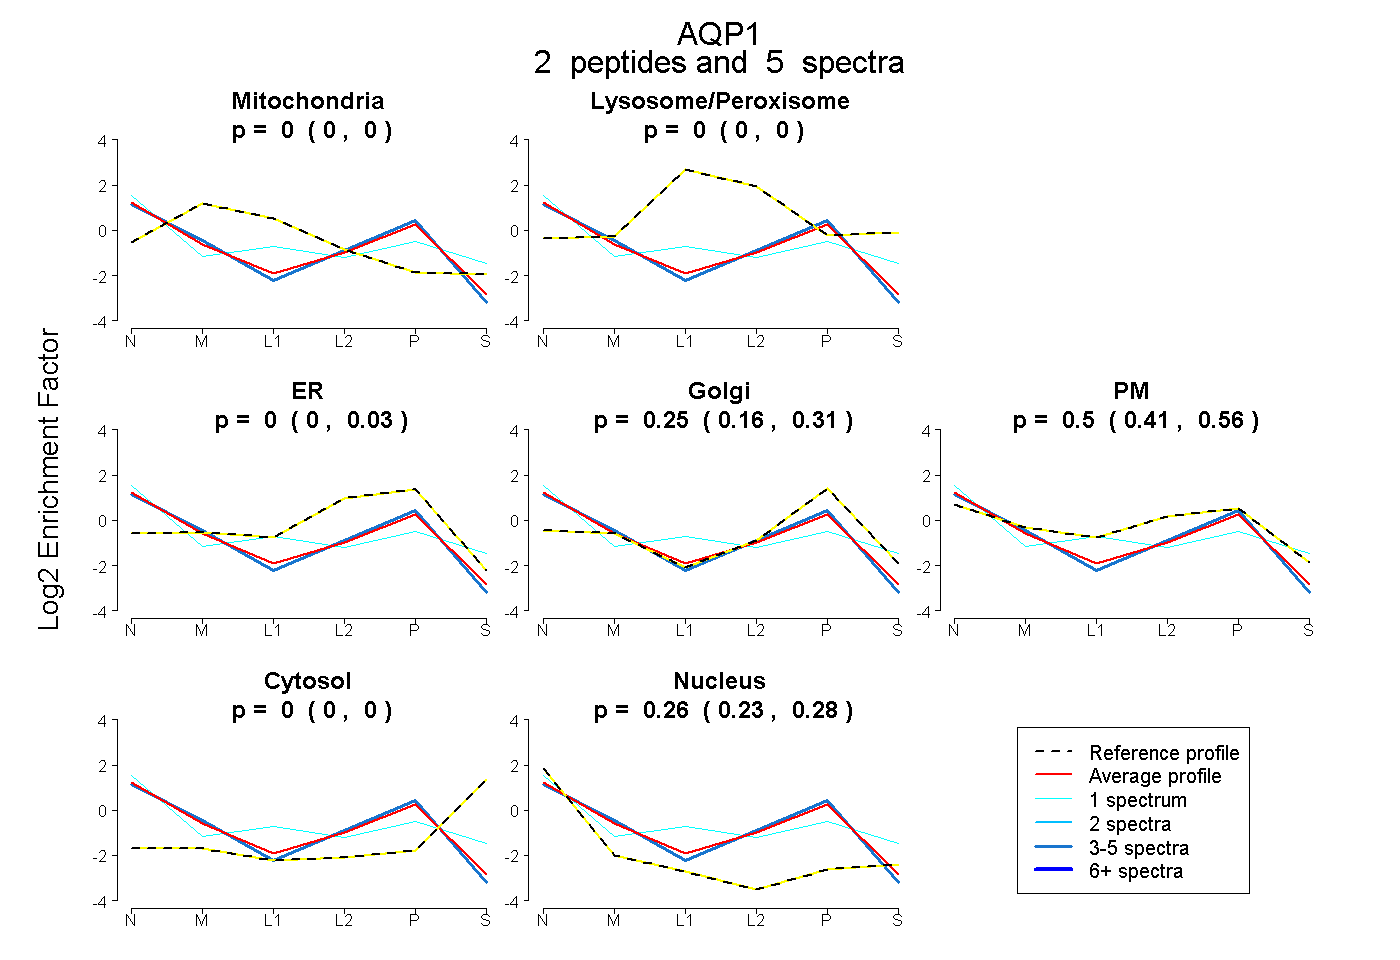
0.000 | 0.000
0.000 | 0.000
0.000 | 0.031
0.161 | 0.308
0.414 | 0.560
0.000 | 0.000
0.234 | 0.283
4peptides
spectra
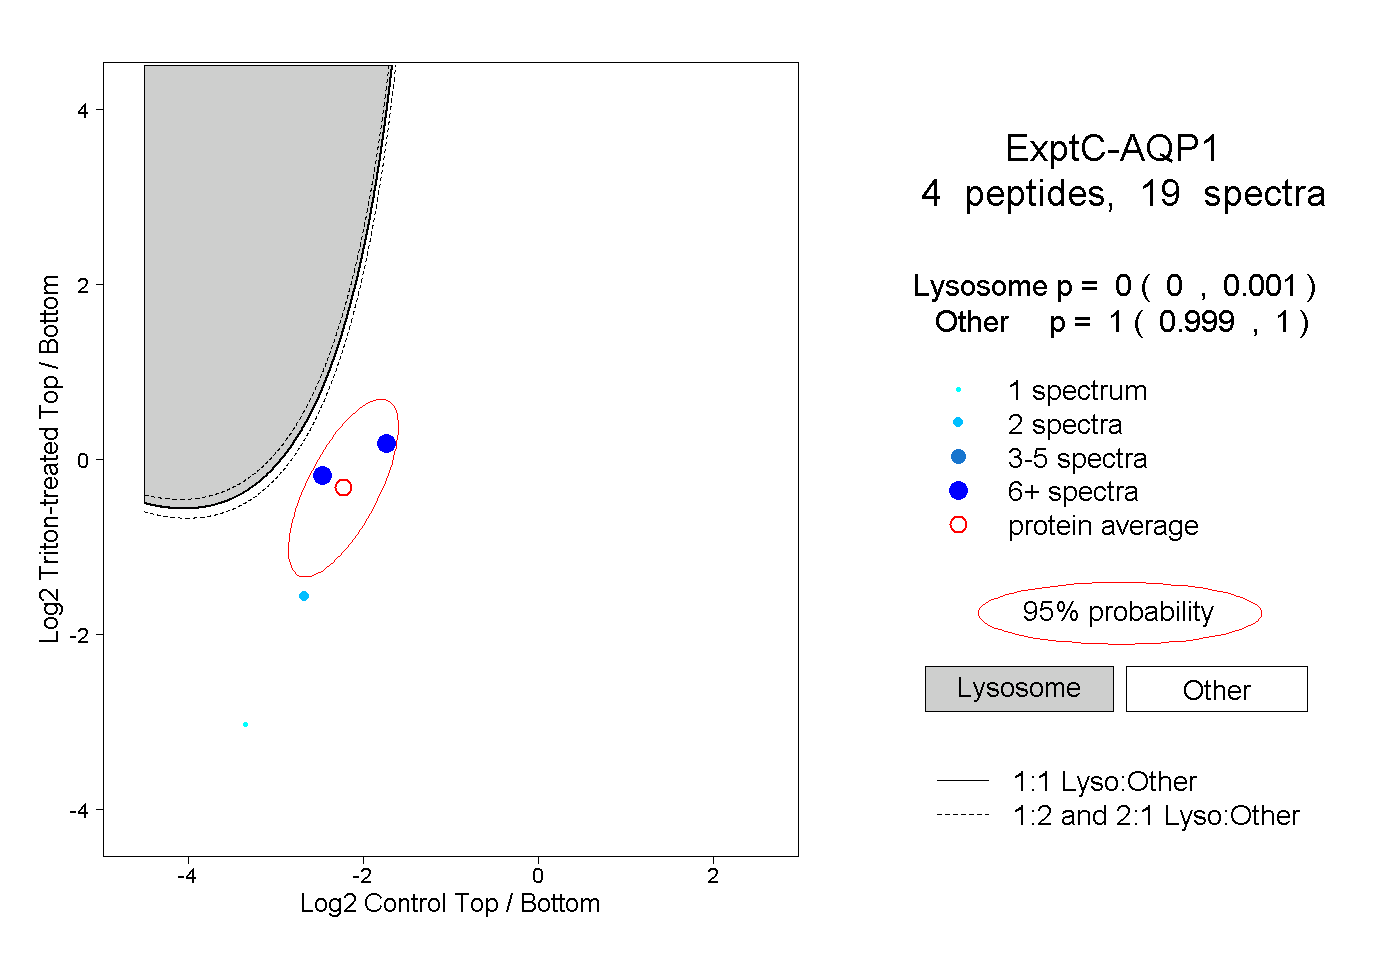
0.000 | 0.001
0.999 | 1.000
1peptide
spectra
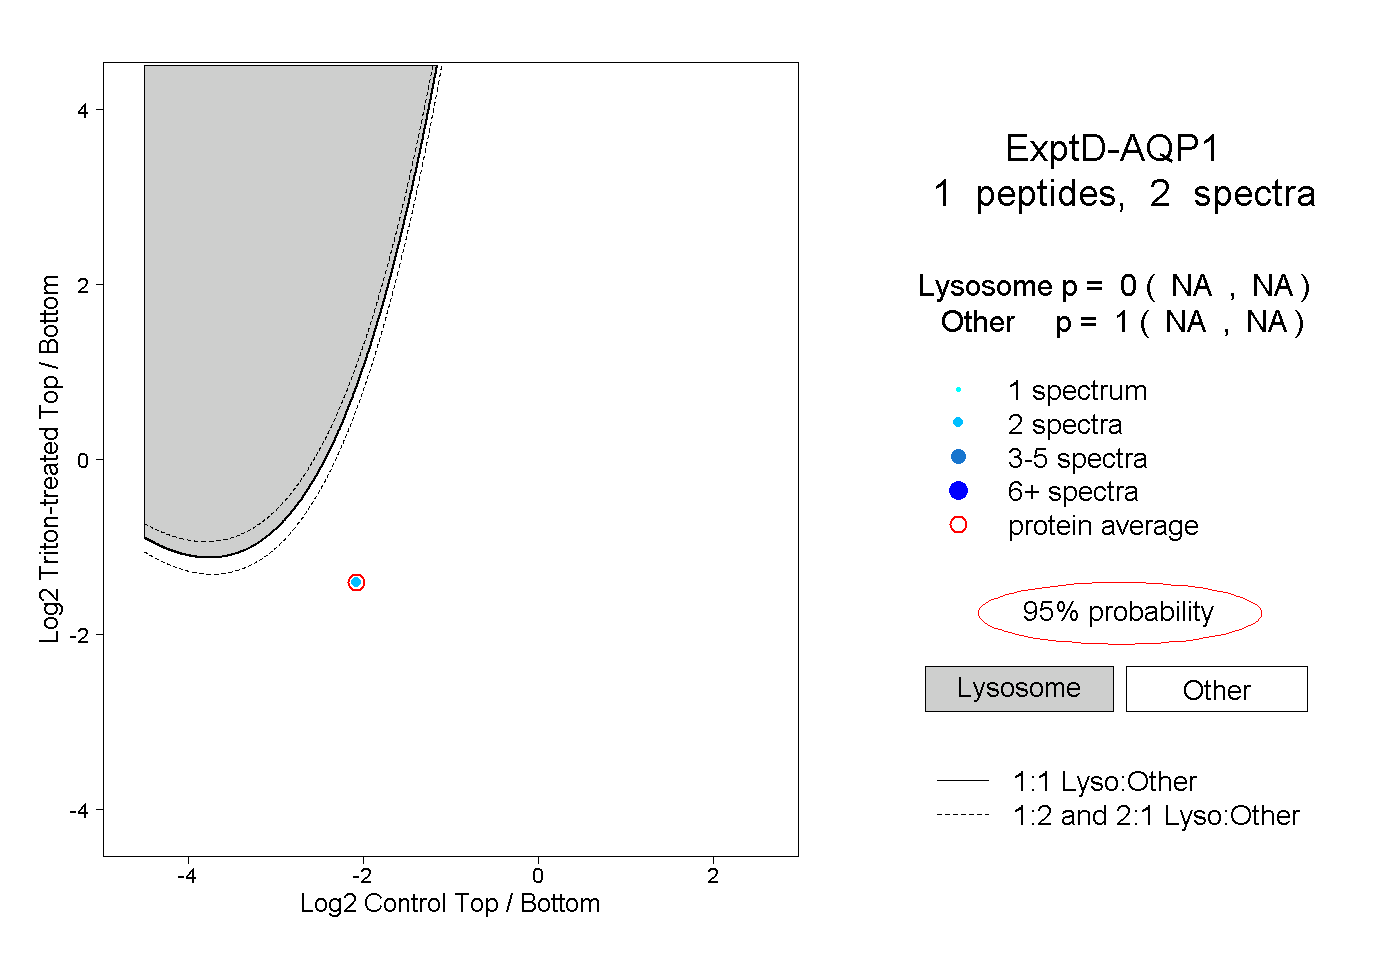
NA | NA
NA | NA