 3
3peptides
spectra
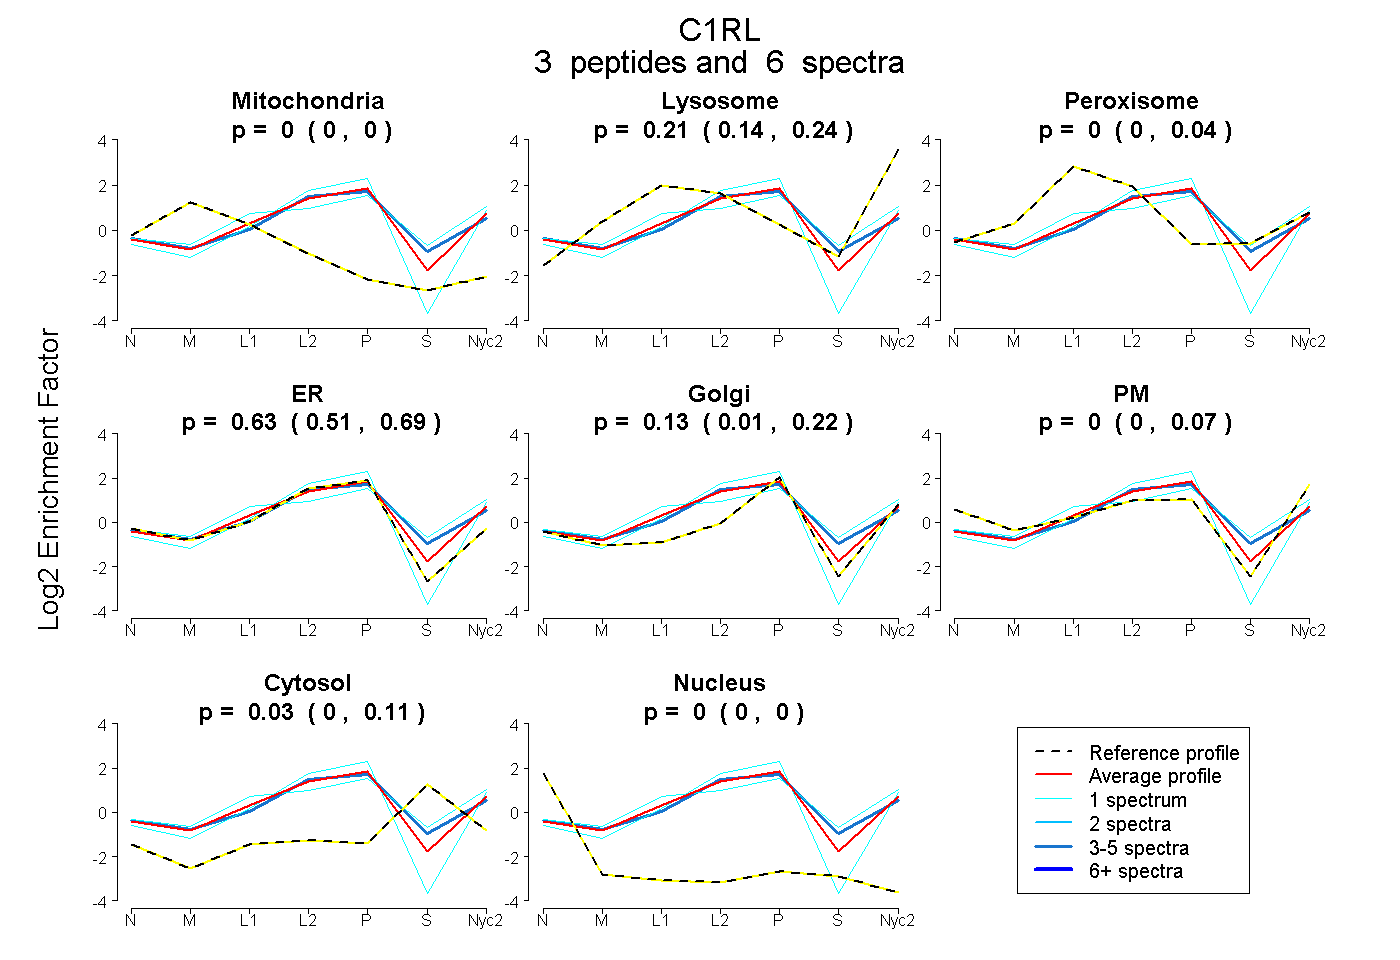
0.000 | 0.000
0.140 | 0.239
0.000 | 0.039
0.513 | 0.693
0.010 | 0.218
0.000 | 0.069
0.000 | 0.106
0.000 | 0.000
6peptides
spectra
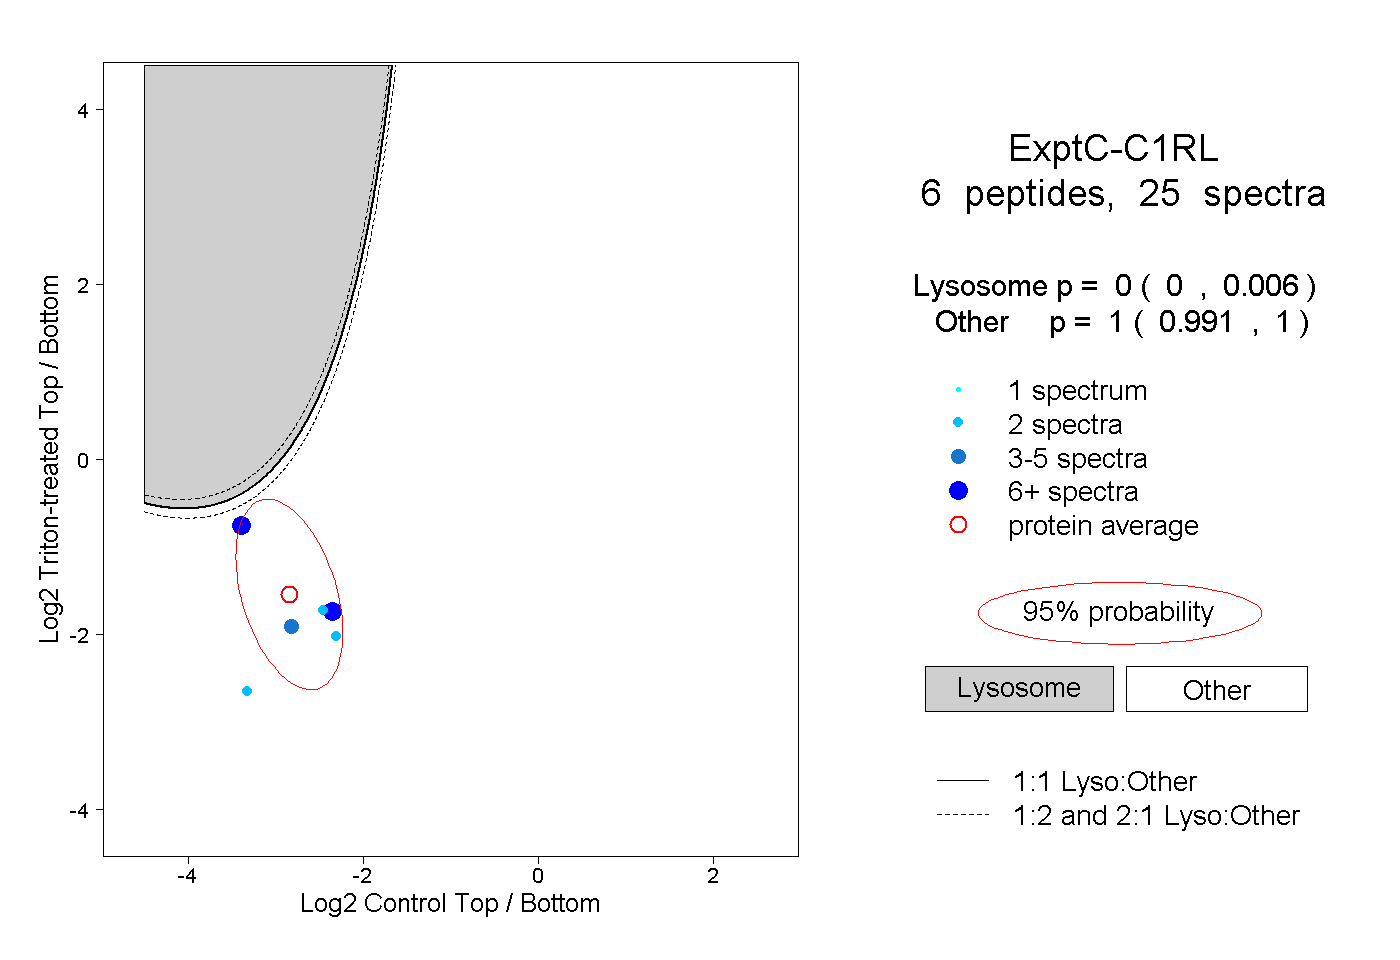
0.000 | 0.006
0.991 | 1.000
| Plot | Mito | Lyso | Perox | ER | Golgi | PM | Cytosol | Nucleus | |||||
| Expt A |
3 peptides |
6 spectra |
|
0.000 0.000 | 0.000 |
0.207 0.140 | 0.239 |
0.000 0.000 | 0.039 |
0.629 0.513 | 0.693 |
0.131 0.010 | 0.218 |
0.000 0.000 | 0.069 |
0.033 0.000 | 0.106 |
0.000 0.000 | 0.000 |
||
| Plot | Lyso | Other | |||||||||||
| Expt C |
6 peptides |
25 spectra |
|
0.000 0.000 | 0.006 |
1.000 0.991 | 1.000 |