 4
4peptides
spectra
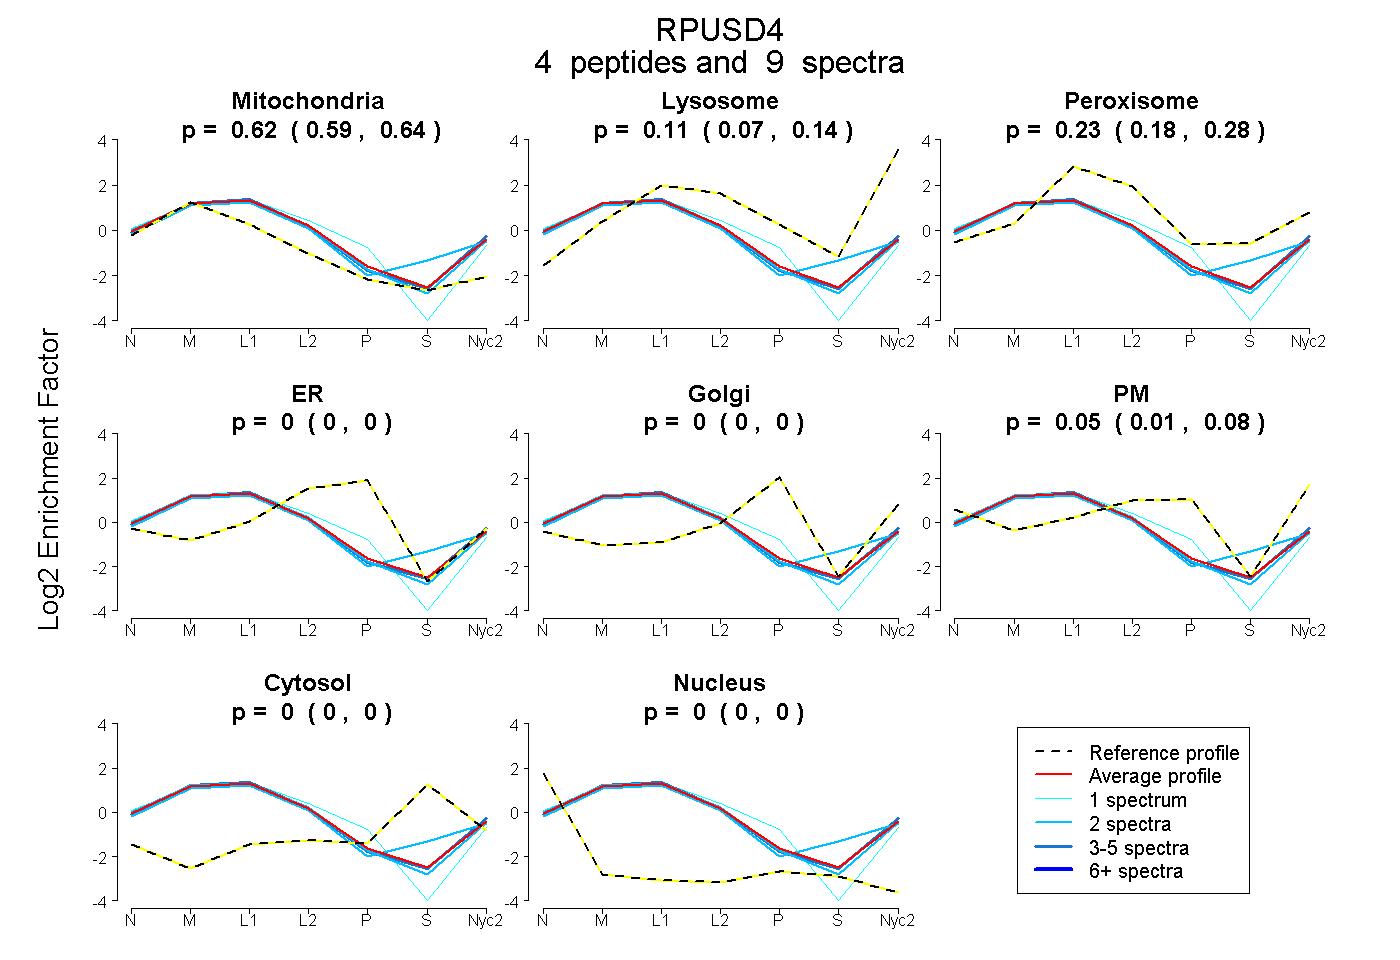
0.591 | 0.635
0.068 | 0.136
0.177 | 0.275
0.000 | 0.000
0.000 | 0.000
0.012 | 0.083
0.000 | 0.000
0.000 | 0.000
2peptides
spectra
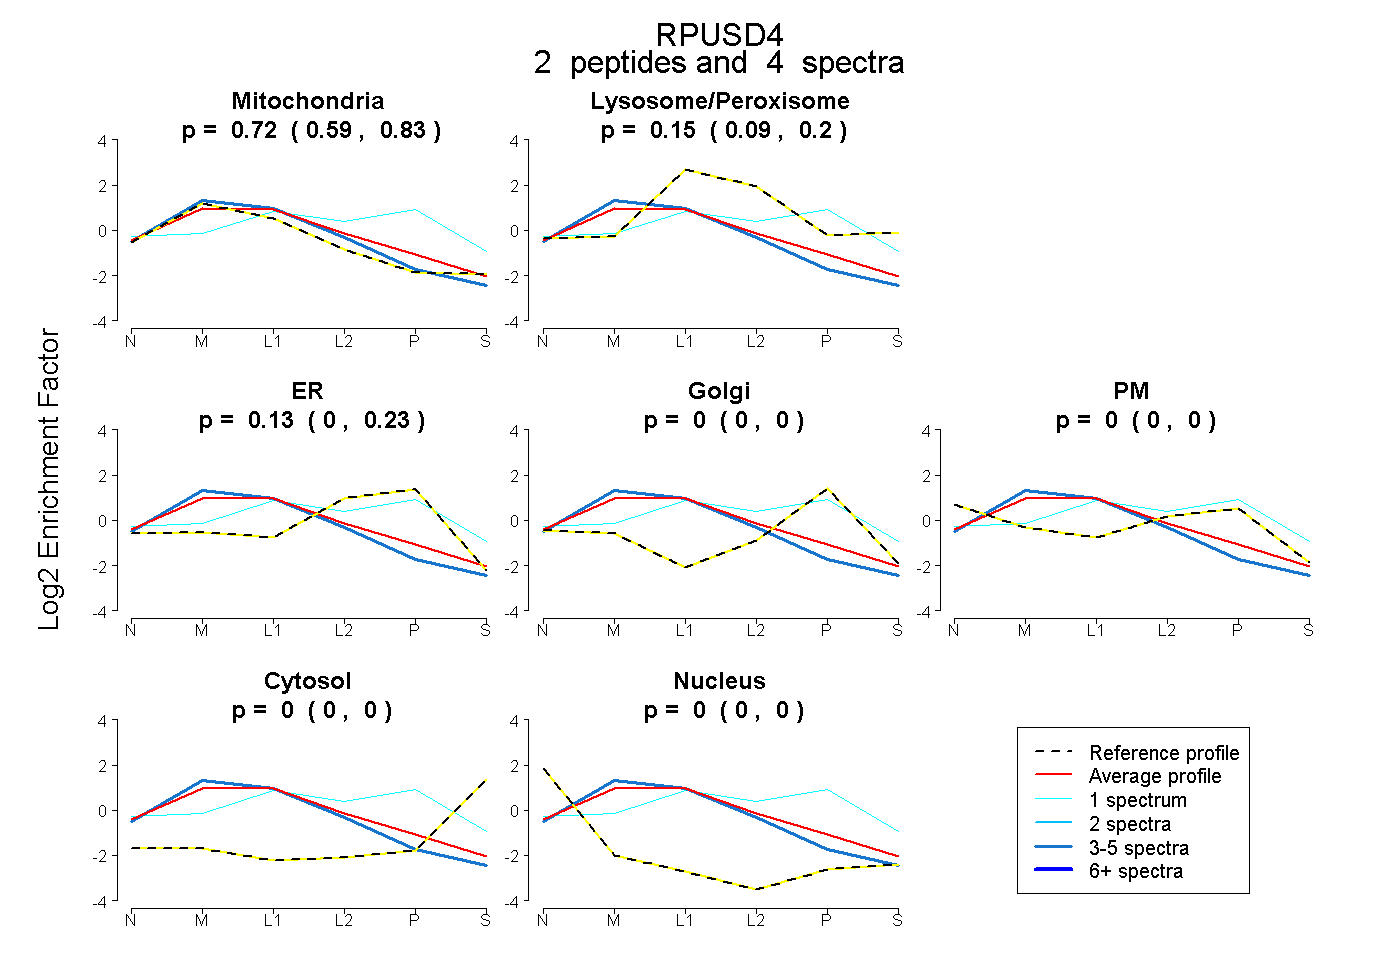
0.592 | 0.828
0.095 | 0.198
0.002 | 0.227
0.000 | 0.000
0.000 | 0.000
0.000 | 0.000
0.000 | 0.000
13peptides
spectra
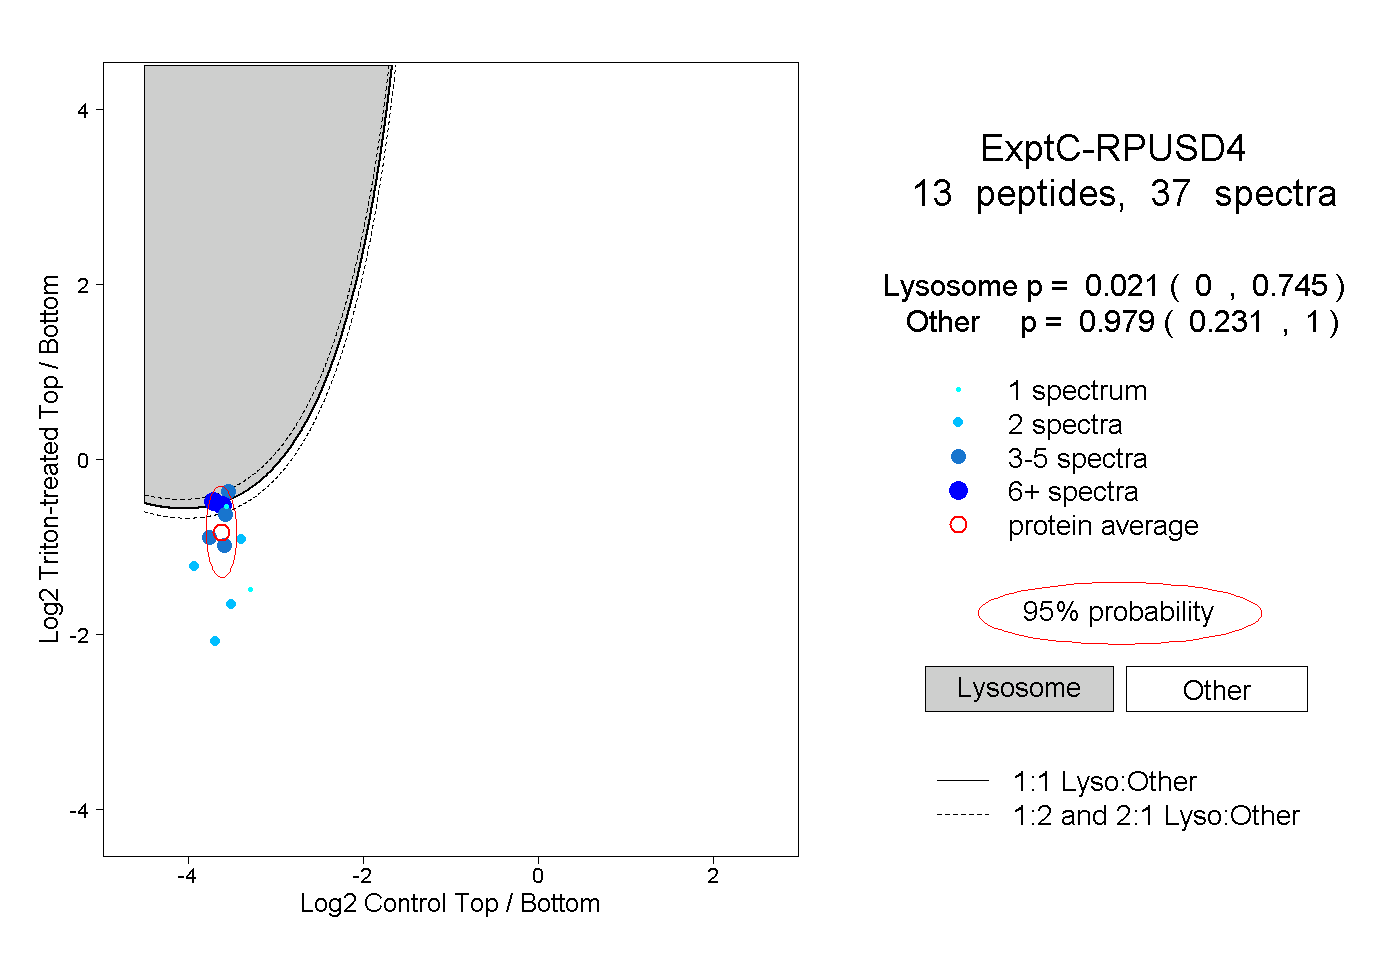
0.000 | 0.745
0.231 | 1.000
3peptides
spectra
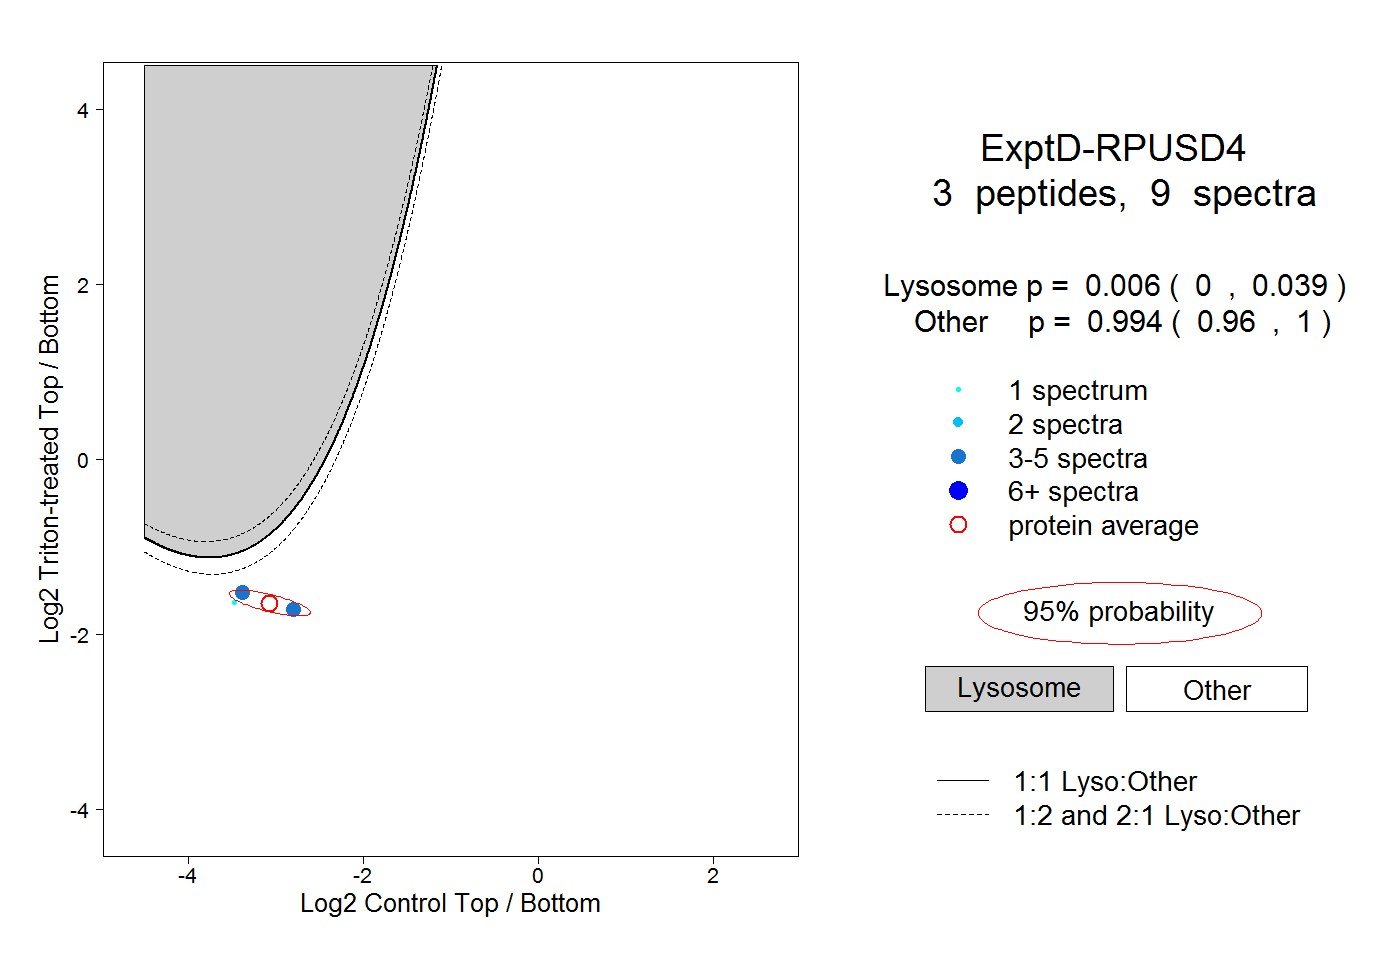
0.000 | 0.039
0.960 | 1.000