 19
19peptides
spectra
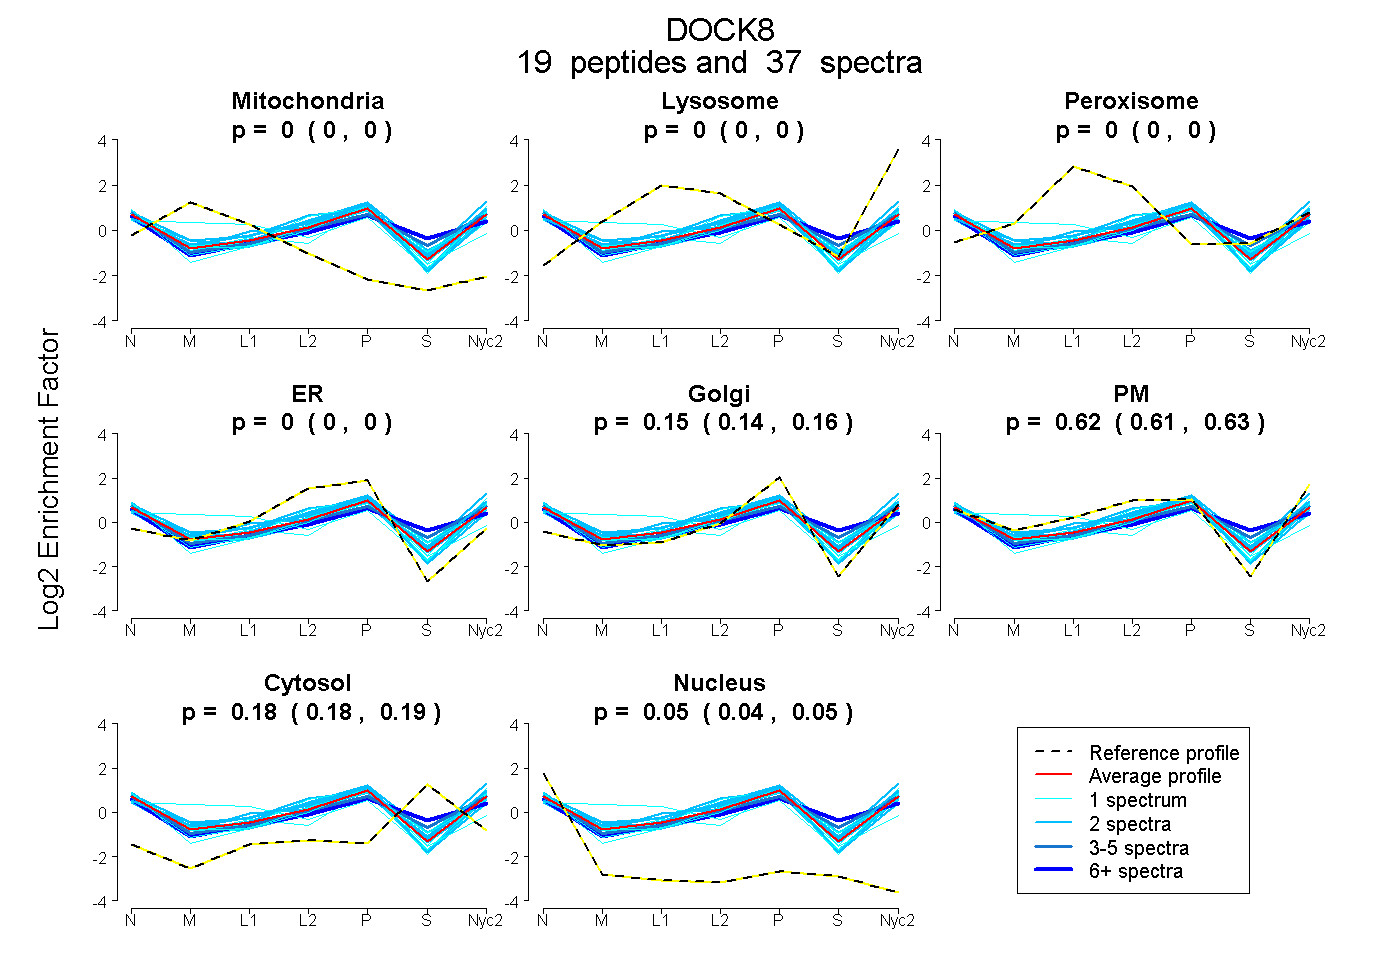
0.000 | 0.000
0.000 | 0.000
0.000 | 0.000
0.000 | 0.000
0.143 | 0.159
0.612 | 0.626
0.178 | 0.189
0.042 | 0.048
3peptides
spectra
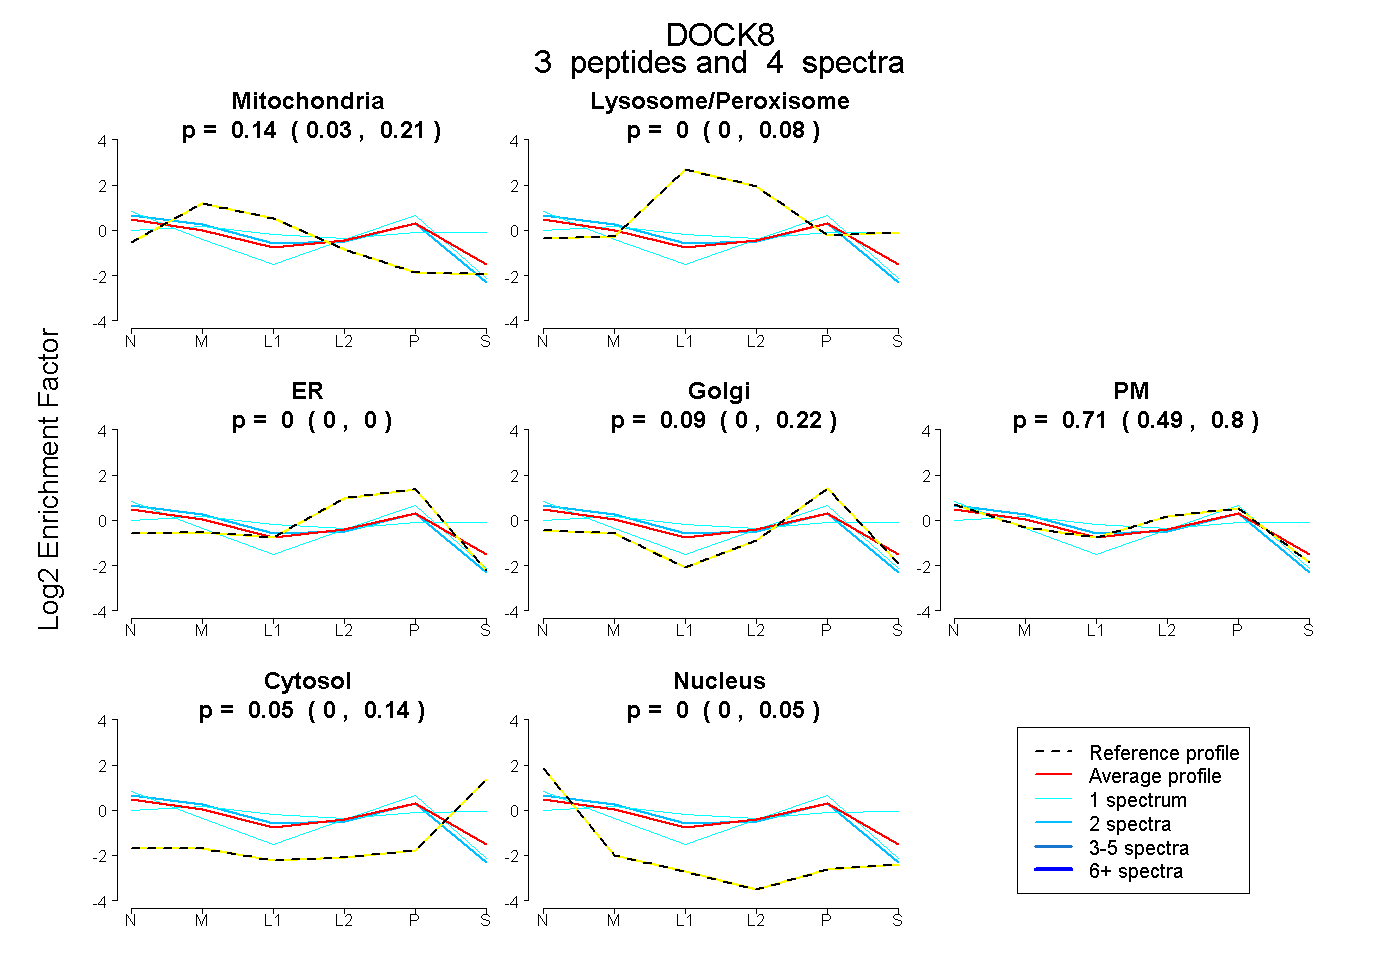
0.029 | 0.211
0.000 | 0.077
0.000 | 0.000
0.000 | 0.225
0.493 | 0.802
0.000 | 0.144
0.000 | 0.054
16peptides
spectra
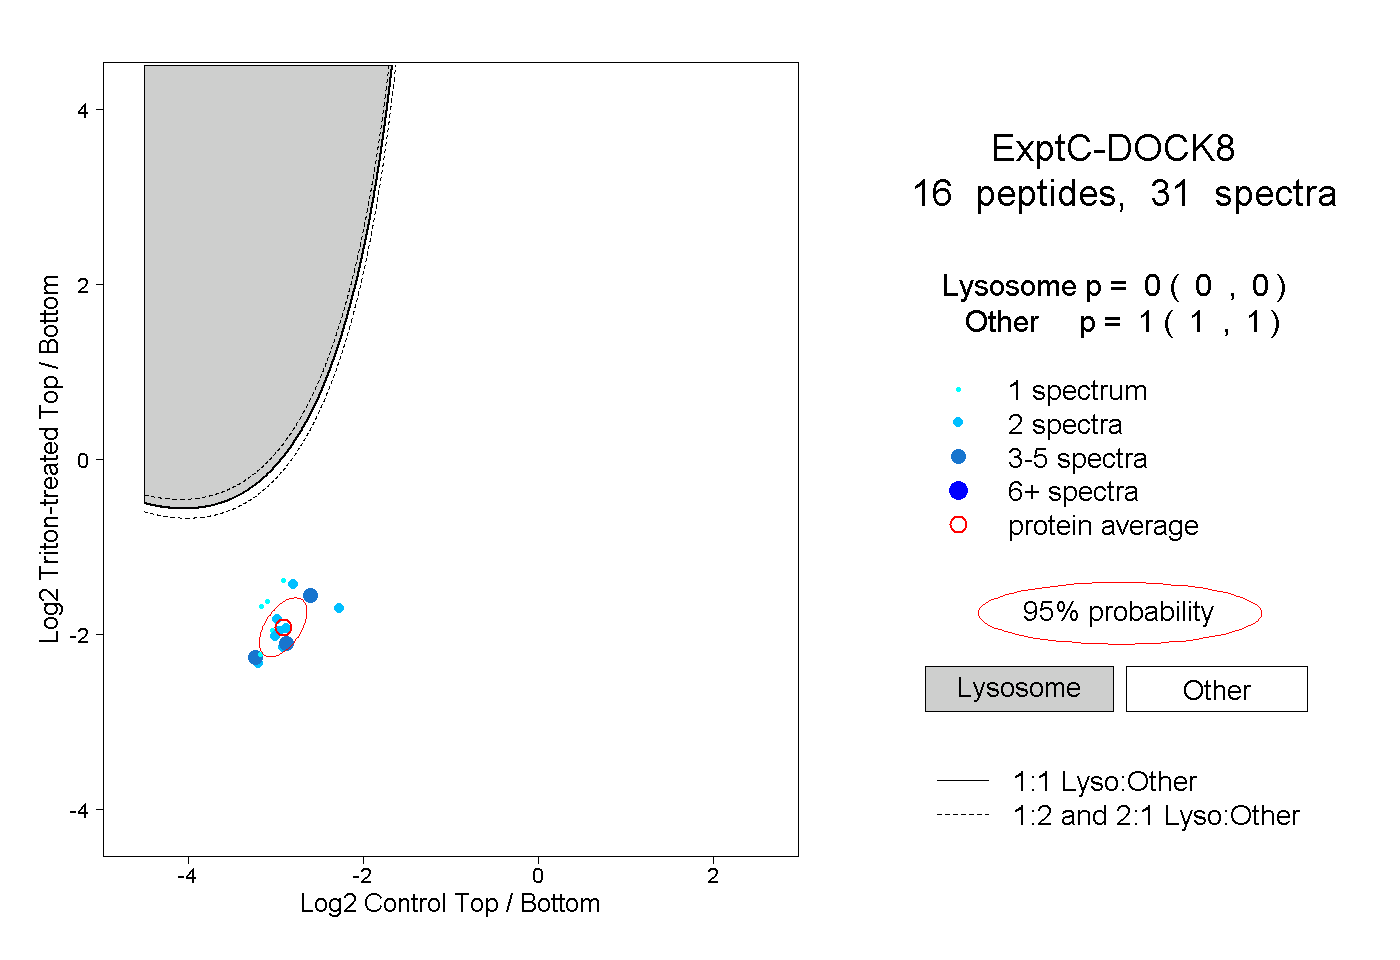
0.000 | 0.000
1.000 | 1.000
2peptides
spectra
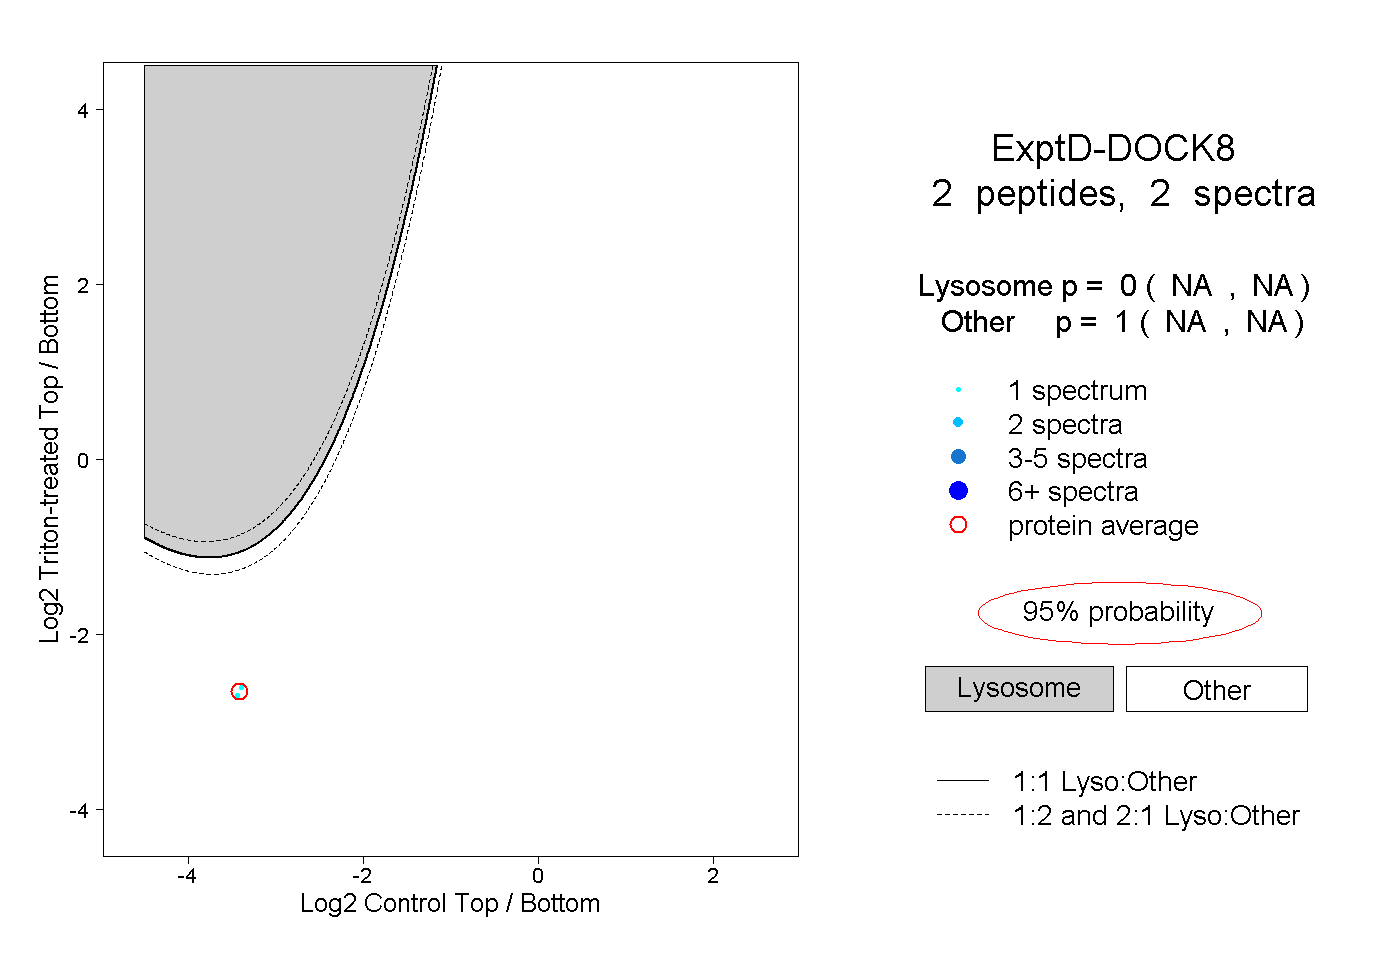
NA | NA
NA | NA