 6
6peptides
spectra
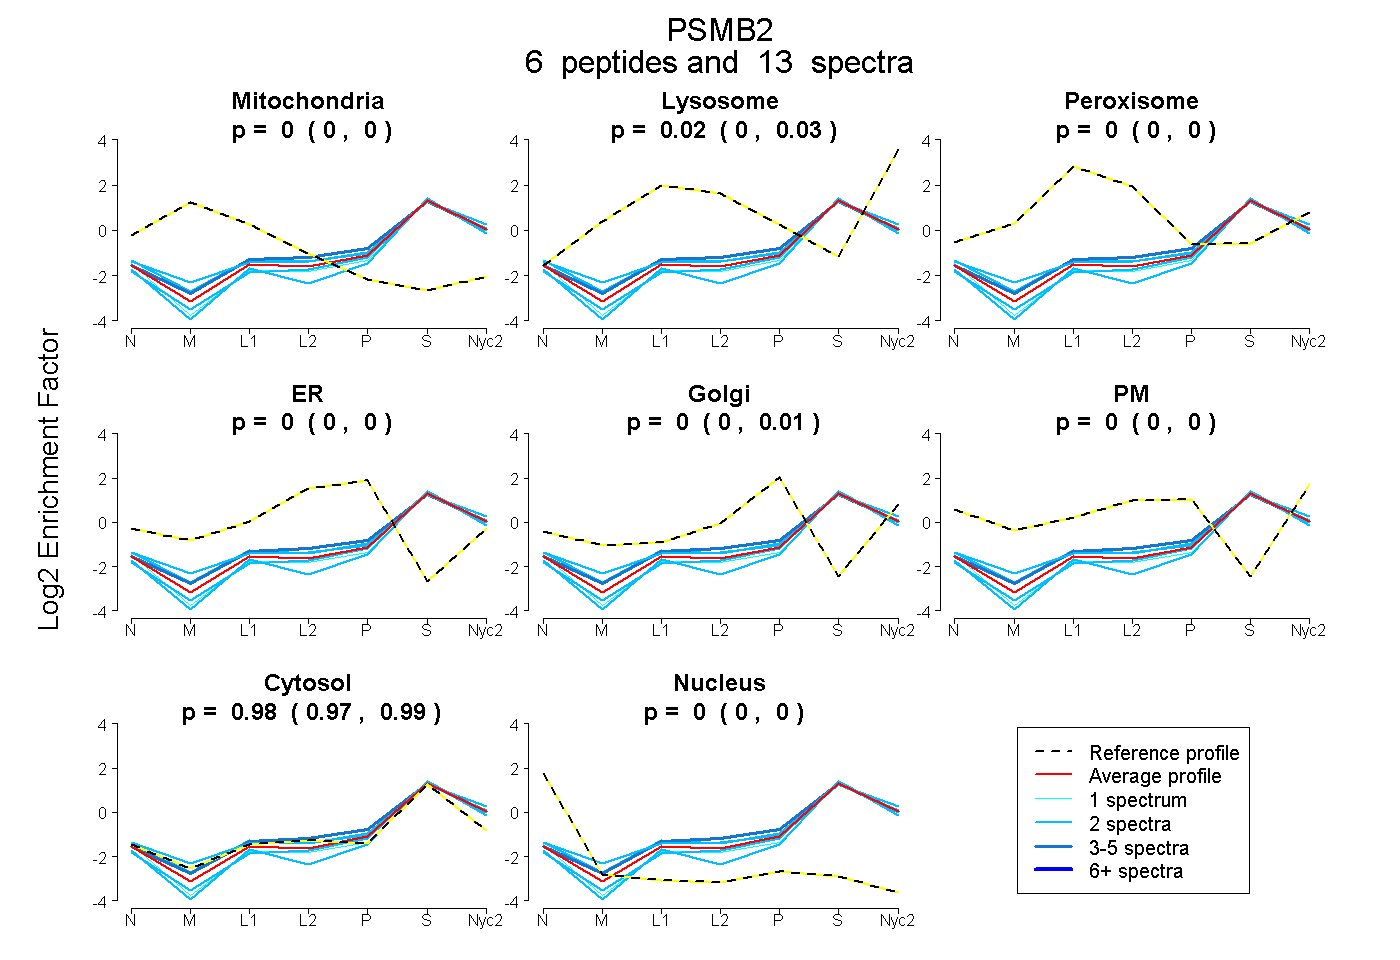
0.000 | 0.000
0.005 | 0.028
0.000 | 0.000
0.000 | 0.000
0.000 | 0.011
0.000 | 0.000
0.968 | 0.987
0.000 | 0.000
4peptides
spectra
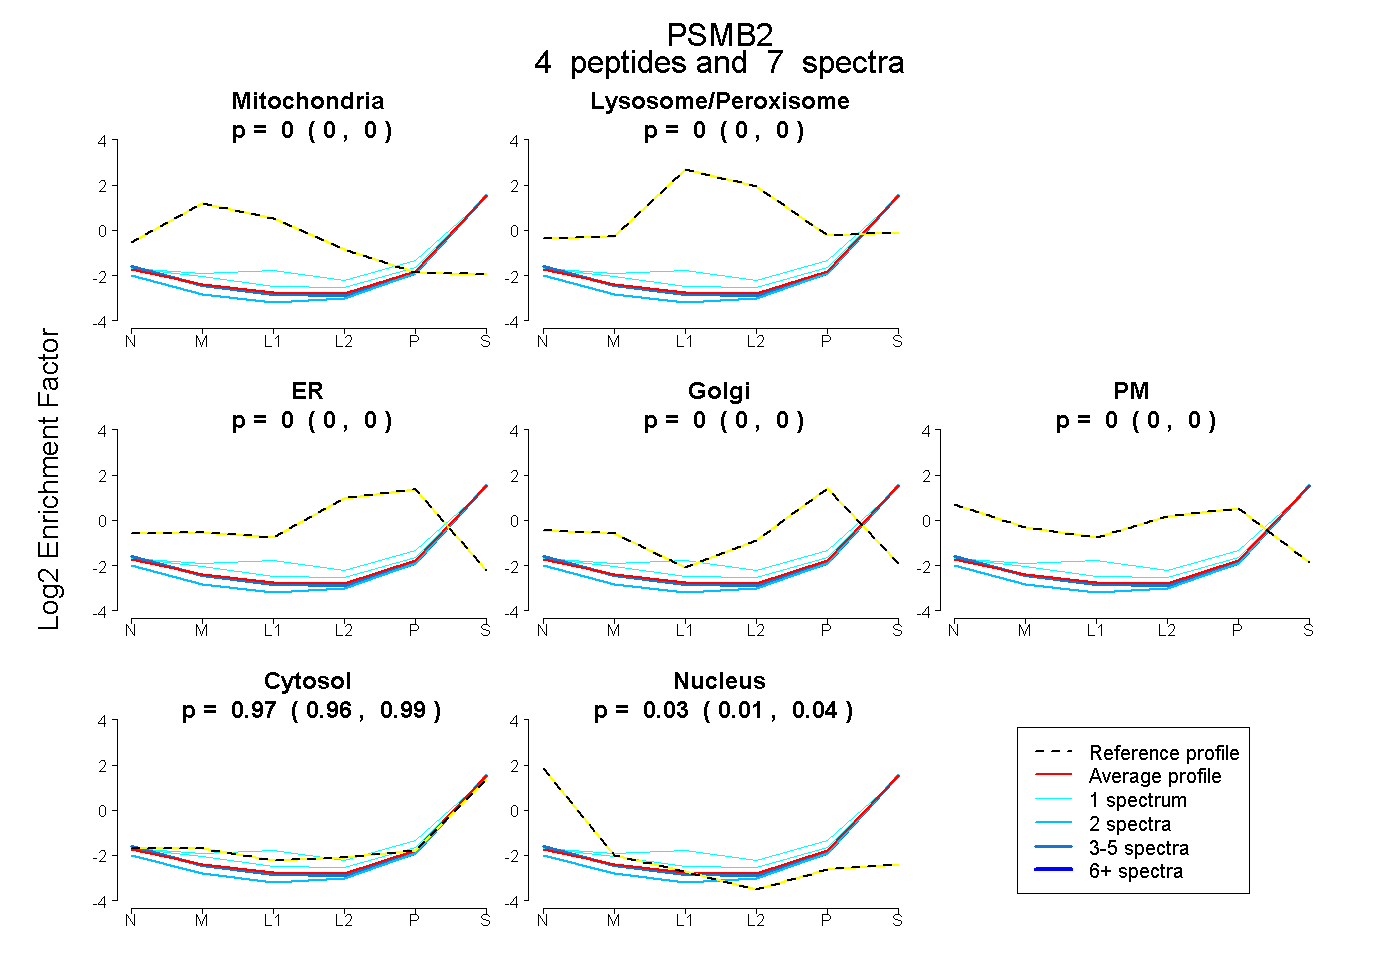
0.000 | 0.000
0.000 | 0.000
0.000 | 0.000
0.000 | 0.000
0.000 | 0.000
0.959 | 0.987
0.011 | 0.038
7peptides
spectra
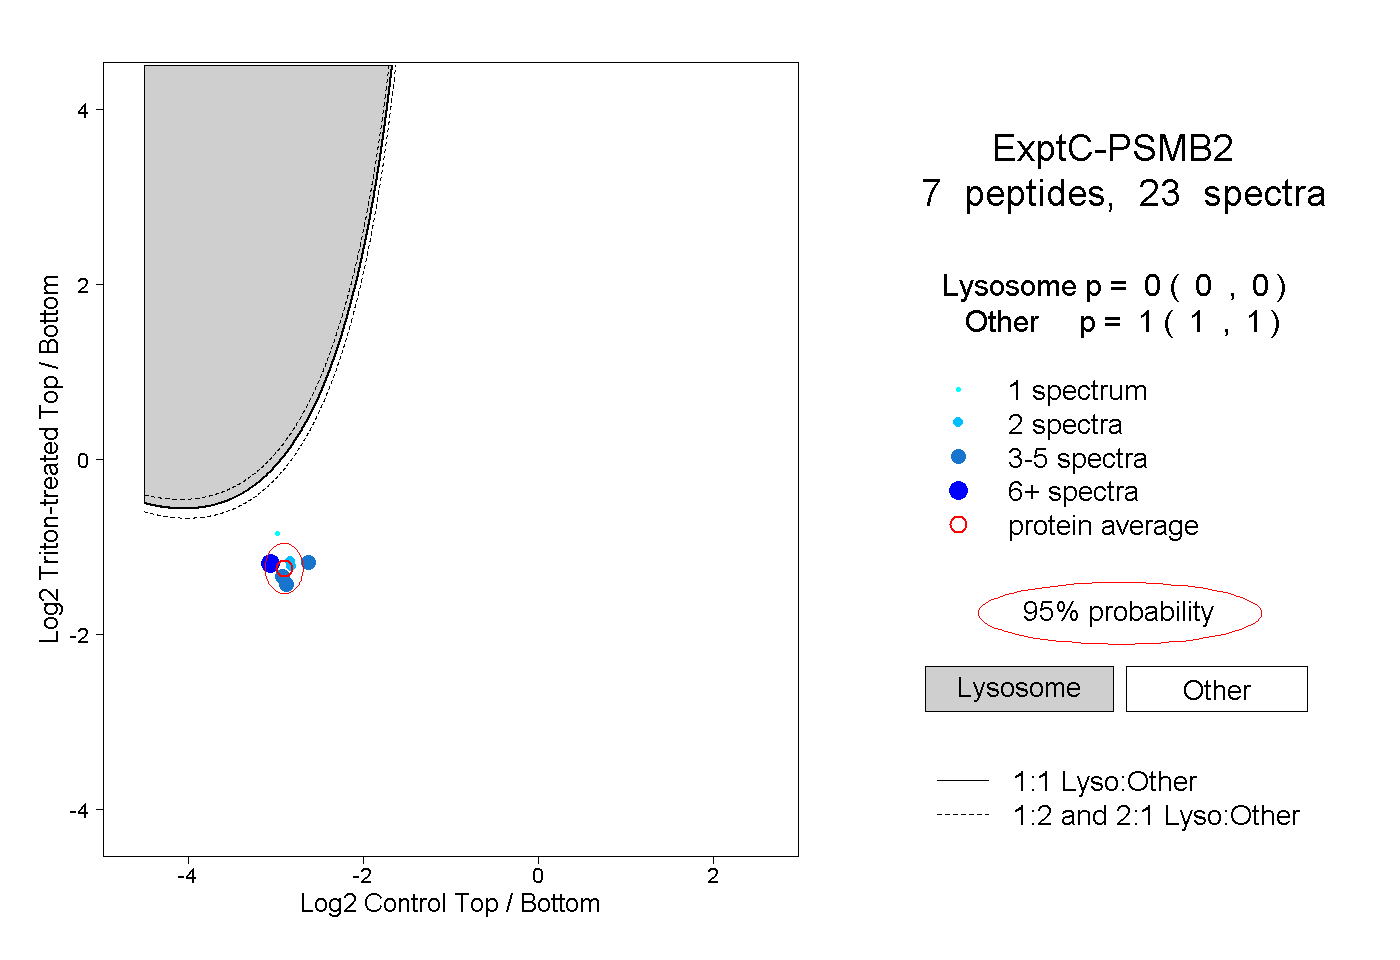
0.000 | 0.000
1.000 | 1.000