 6
6peptides
spectra
0.000 | 0.000
0.005 | 0.028
0.000 | 0.000
0.000 | 0.000
0.000 | 0.011
0.000 | 0.000
0.968 | 0.987
0.000 | 0.000
| Plot | Mito | Lyso | Perox | ER | Golgi | PM | Cytosol | Nucleus | |||||
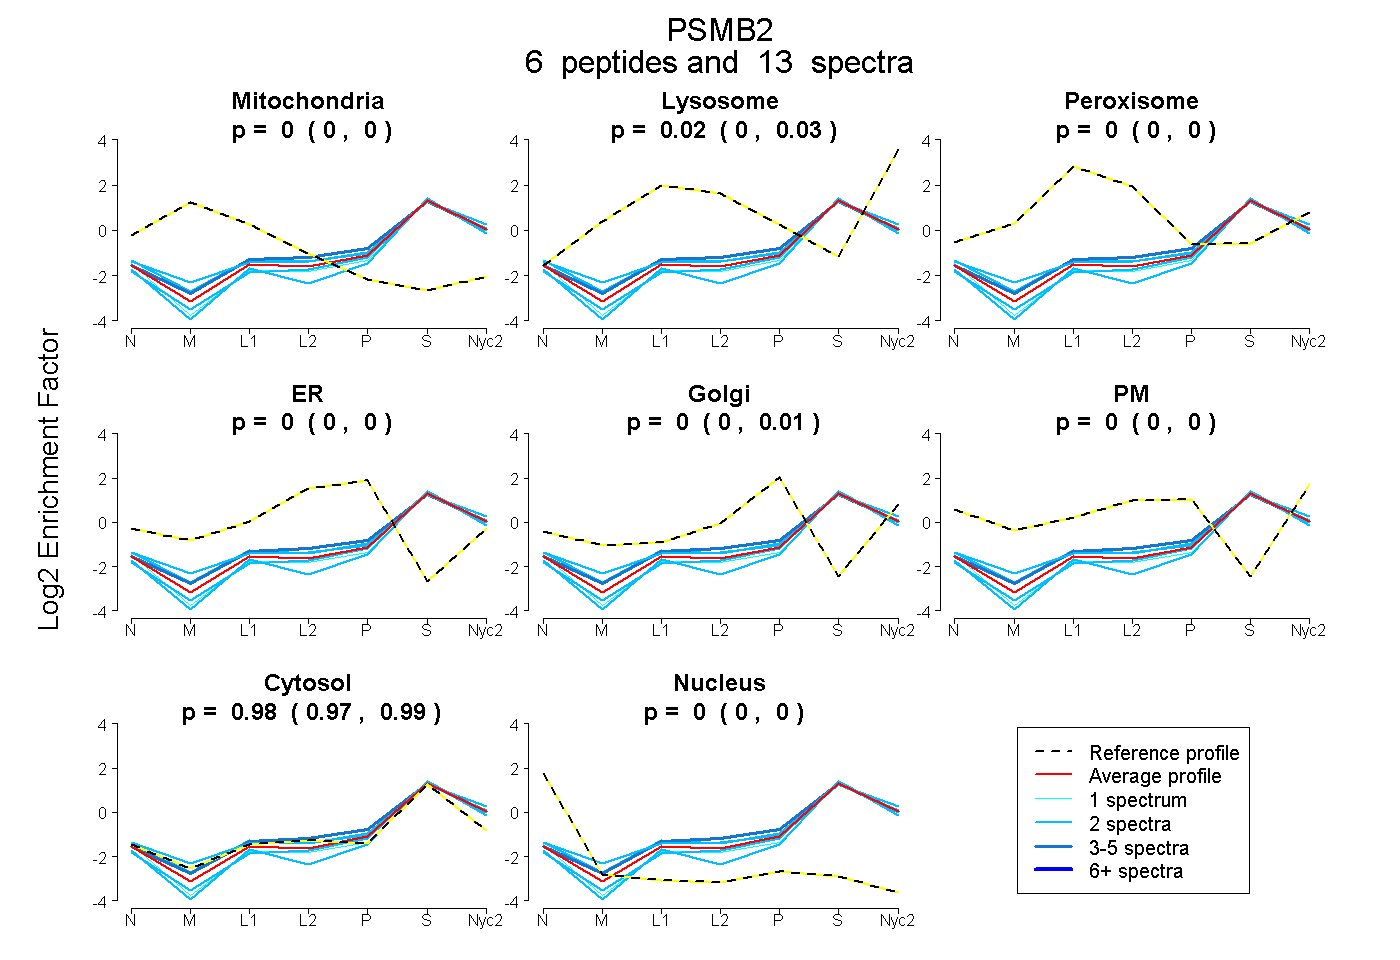
| Expt A |
6 peptides |
13 spectra |
|
0.000 0.000 | 0.000 |
0.019 0.005 | 0.028 |
0.000 0.000 | 0.000 |
0.000 0.000 | 0.000 |
0.002 0.000 | 0.011 |
0.000 0.000 | 0.000 |
0.980 0.968 | 0.987 |
0.000 0.000 | 0.000 |
| 4 spectra, NLADCLR | 0.000 | 0.068 | 0.000 | 0.000 | 0.028 | 0.000 | 0.904 | 0.000 | ||
| 2 spectra, NGYELSPTAAANFTR | 0.000 | 0.091 | 0.000 | 0.000 | 0.004 | 0.000 | 0.905 | 0.000 | ||
| 2 spectra, VAASNIVQMK | 0.000 | 0.000 | 0.000 | 0.000 | 0.000 | 0.000 | 1.000 | 0.000 | ||
| 2 spectra, NVQLYK | 0.000 | 0.088 | 0.000 | 0.000 | 0.009 | 0.000 | 0.904 | 0.000 | ||
| 2 spectra, YYTPTISR | 0.000 | 0.000 | 0.000 | 0.000 | 0.000 | 0.000 | 1.000 | 0.000 | ||
| 1 spectrum, FILNLPTFSVR | 0.000 | 0.000 | 0.000 | 0.000 | 0.000 | 0.000 | 1.000 | 0.000 |
| Plot | Mito | Lyso or Perox | ER | Golgi | PM | Cytosol | Nucleus | ||||||
| Expt B |
4 peptides |
7 spectra |
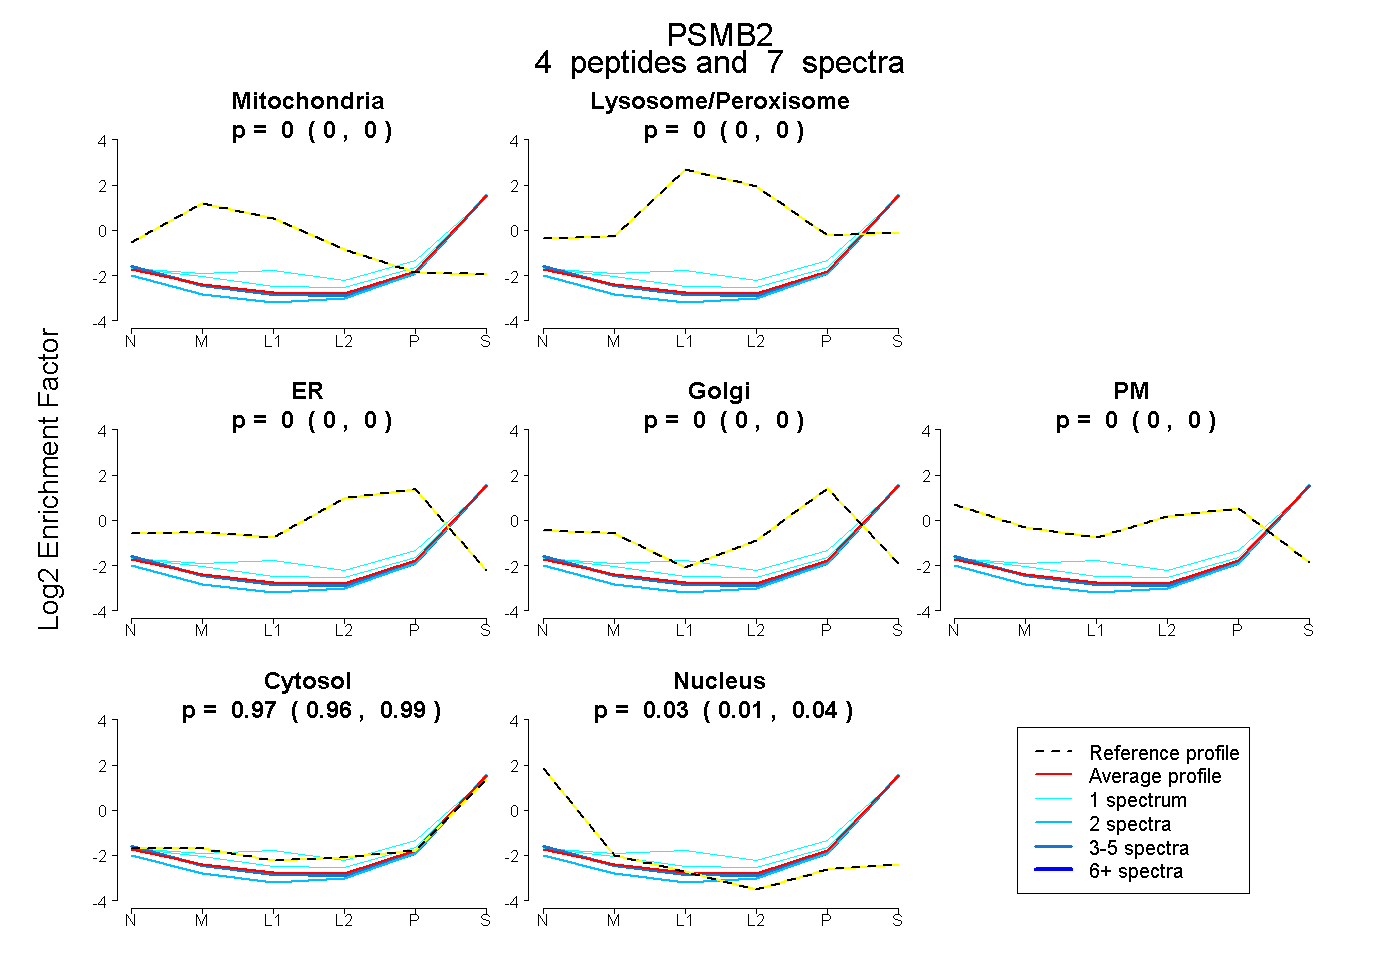 |
0.000 0.000 | 0.000 |
0.000 0.000 | 0.000 |
0.000 0.000 | 0.000 |
0.000 0.000 | 0.000 |
0.000 0.000 | 0.000 |
0.974 0.959 | 0.987 |
0.026 0.011 | 0.038 |
|||
| Plot | Lyso | Other | |||||||||||
| Expt C |
7 peptides |
23 spectra |
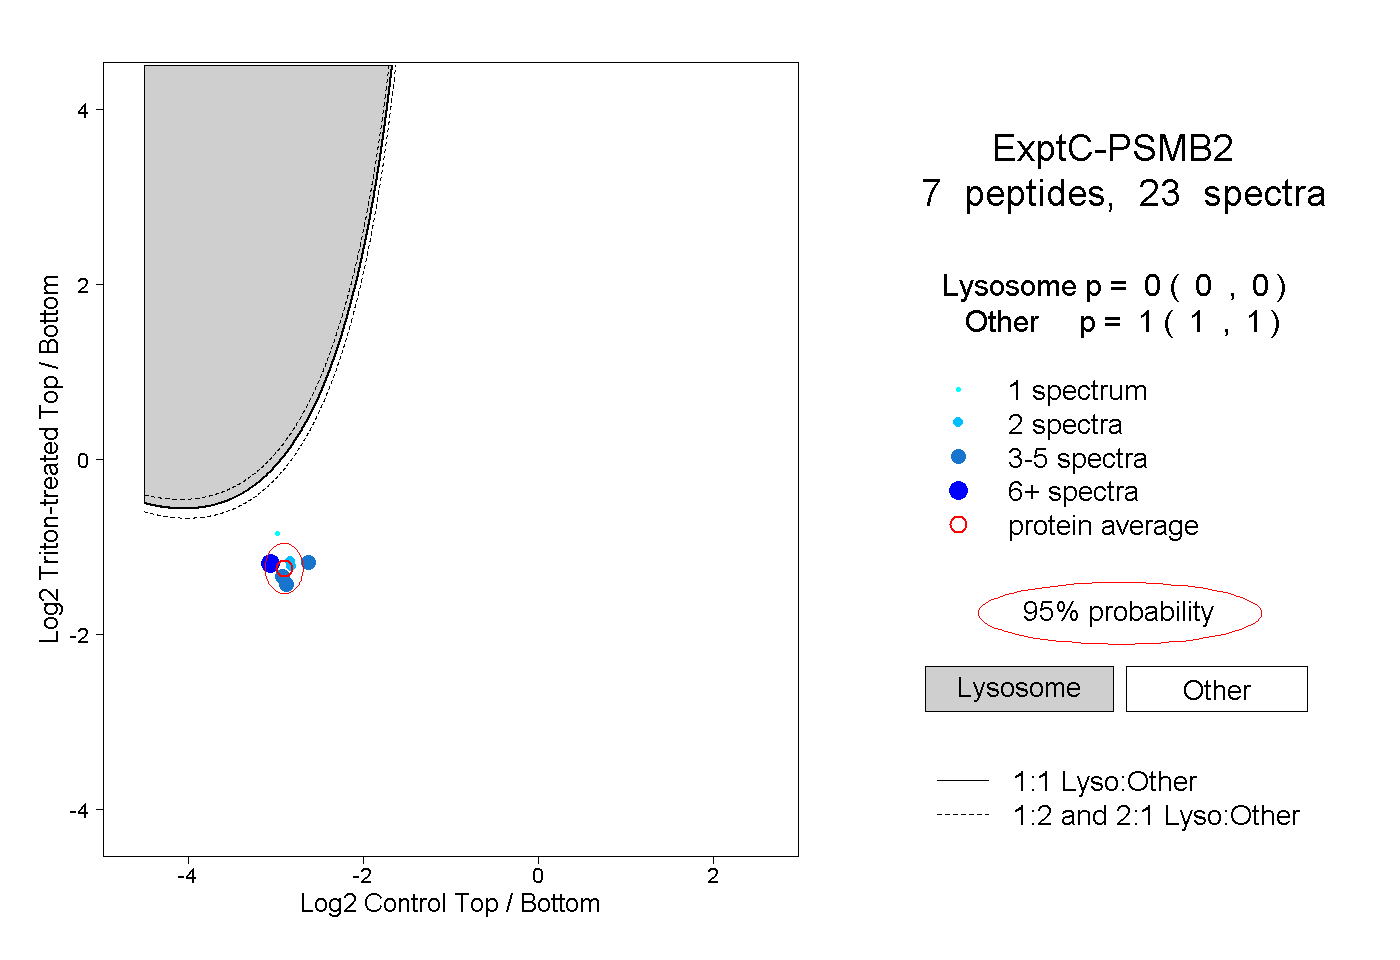 |
0.000 0.000 | 0.000 |
1.000 1.000 | 1.000 |