 2
2peptides
spectra
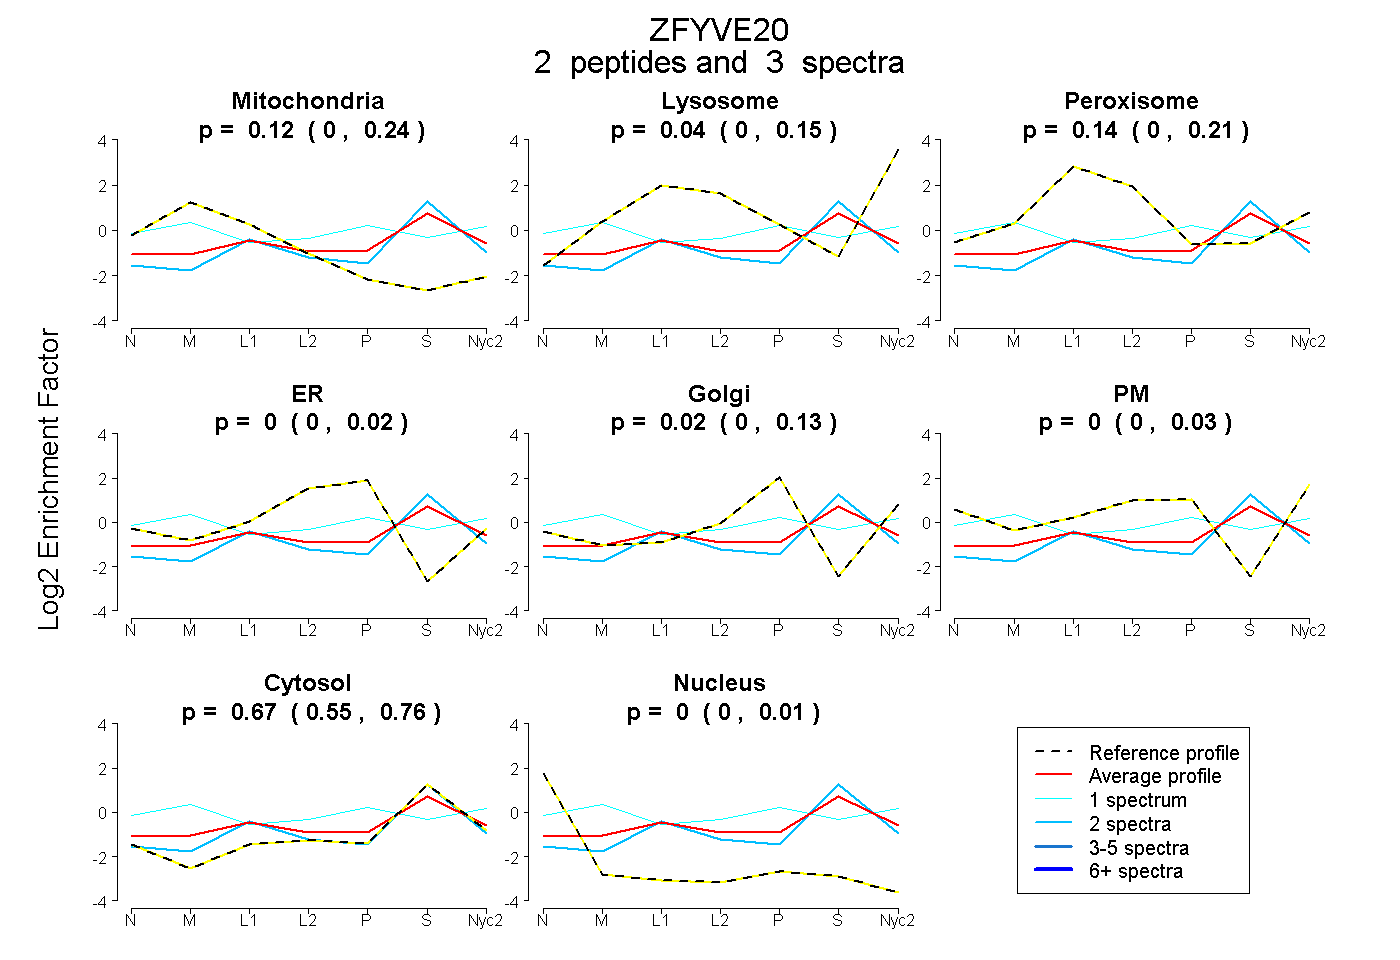
0.000 | 0.241
0.000 | 0.153
0.000 | 0.209
0.000 | 0.024
0.000 | 0.129
0.000 | 0.031
0.545 | 0.757
0.000 | 0.011
3peptides
spectra
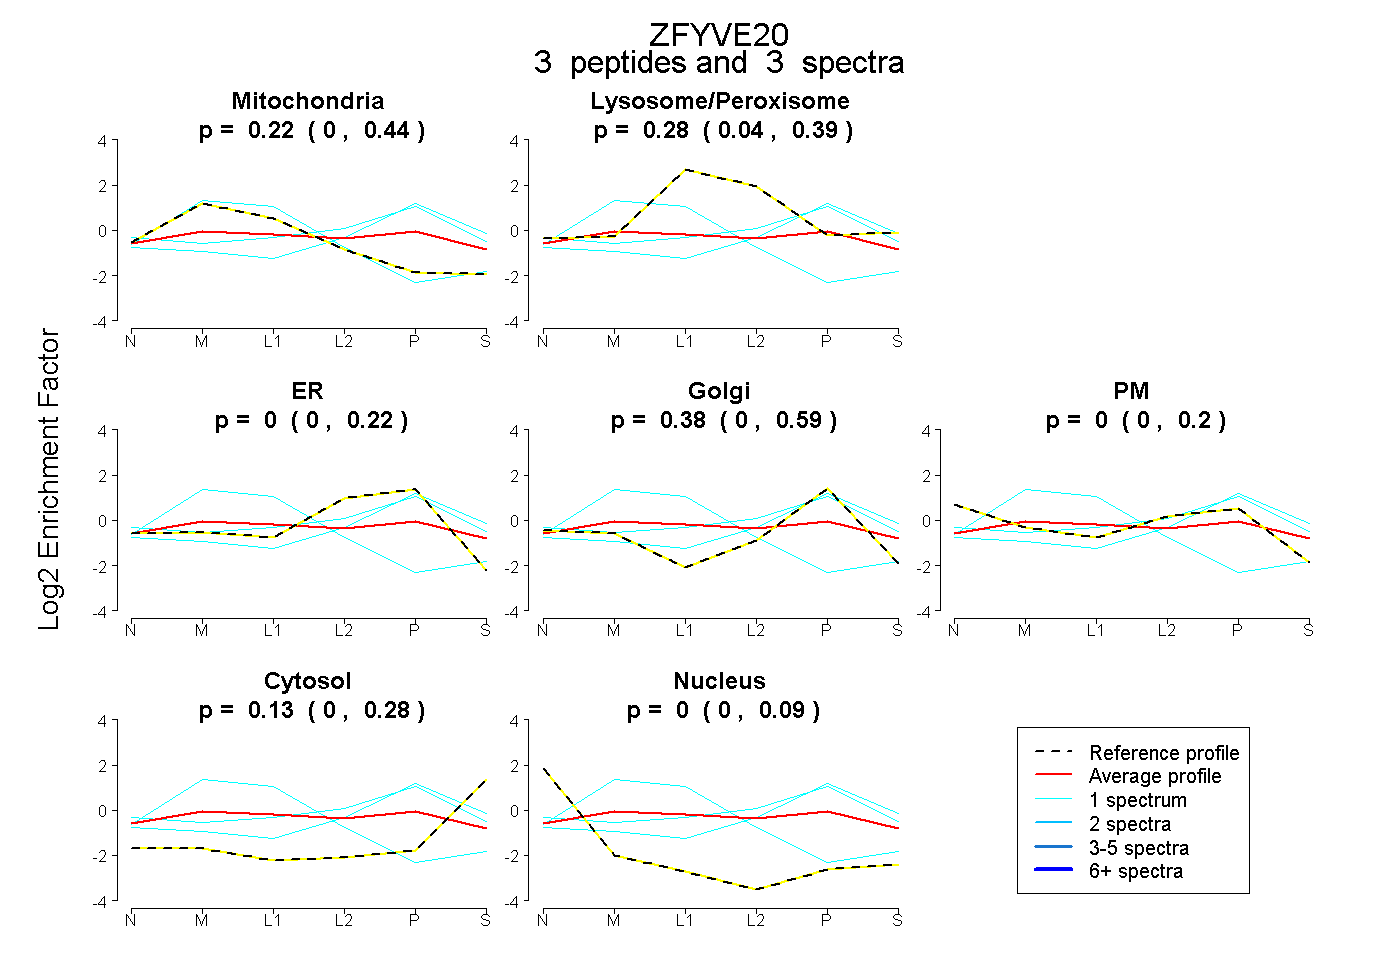
0.000 | 0.444
0.041 | 0.393
0.000 | 0.215
0.000 | 0.586
0.000 | 0.195
0.000 | 0.278
0.000 | 0.088
4peptides
spectra
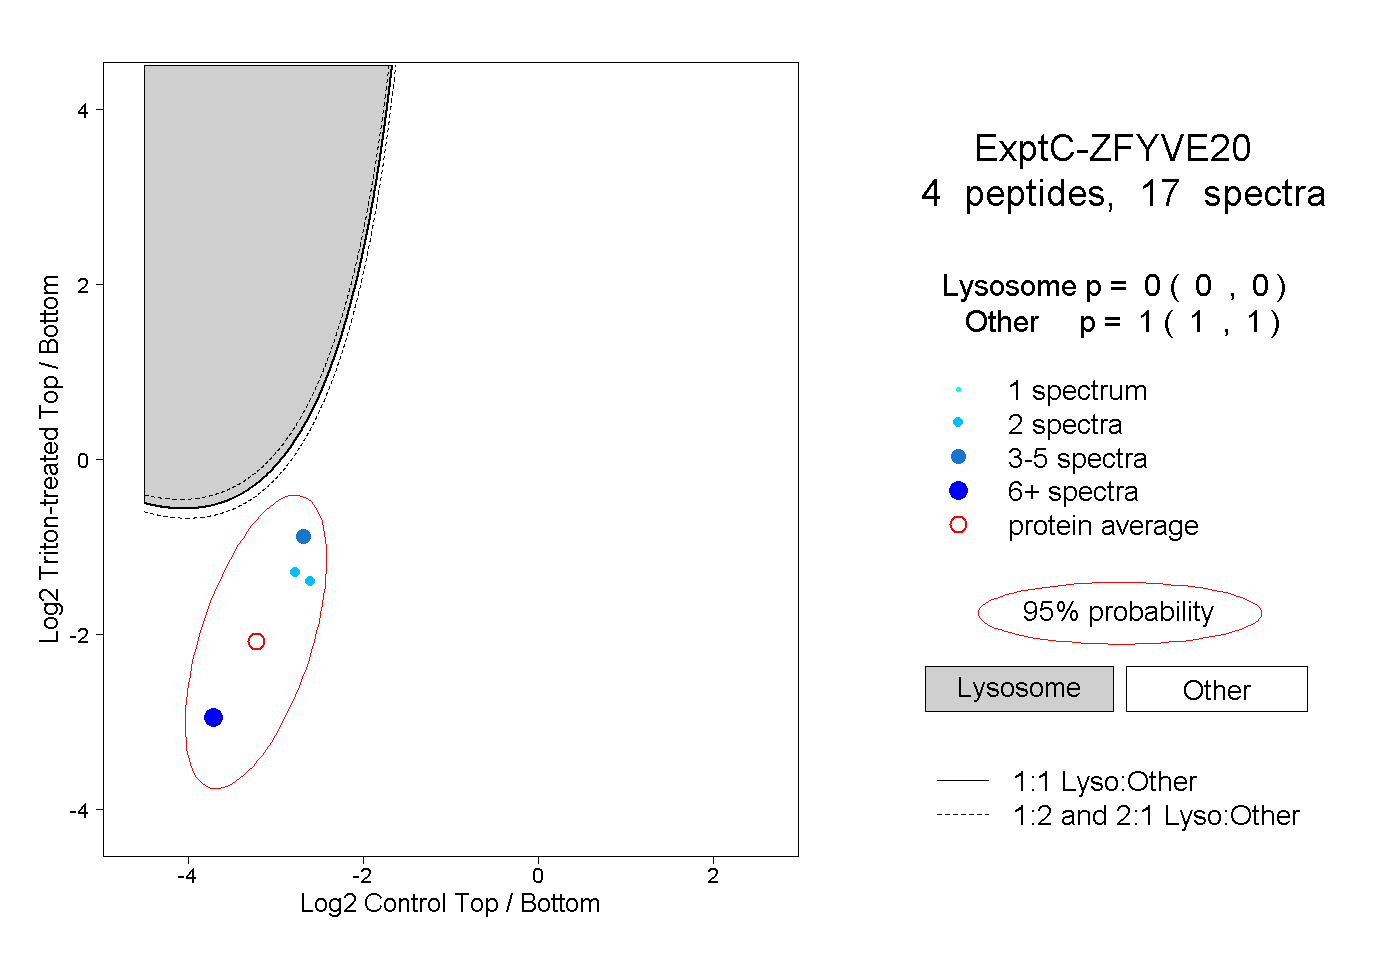
0.000 | 0.000
1.000 | 1.000
3peptides
spectra
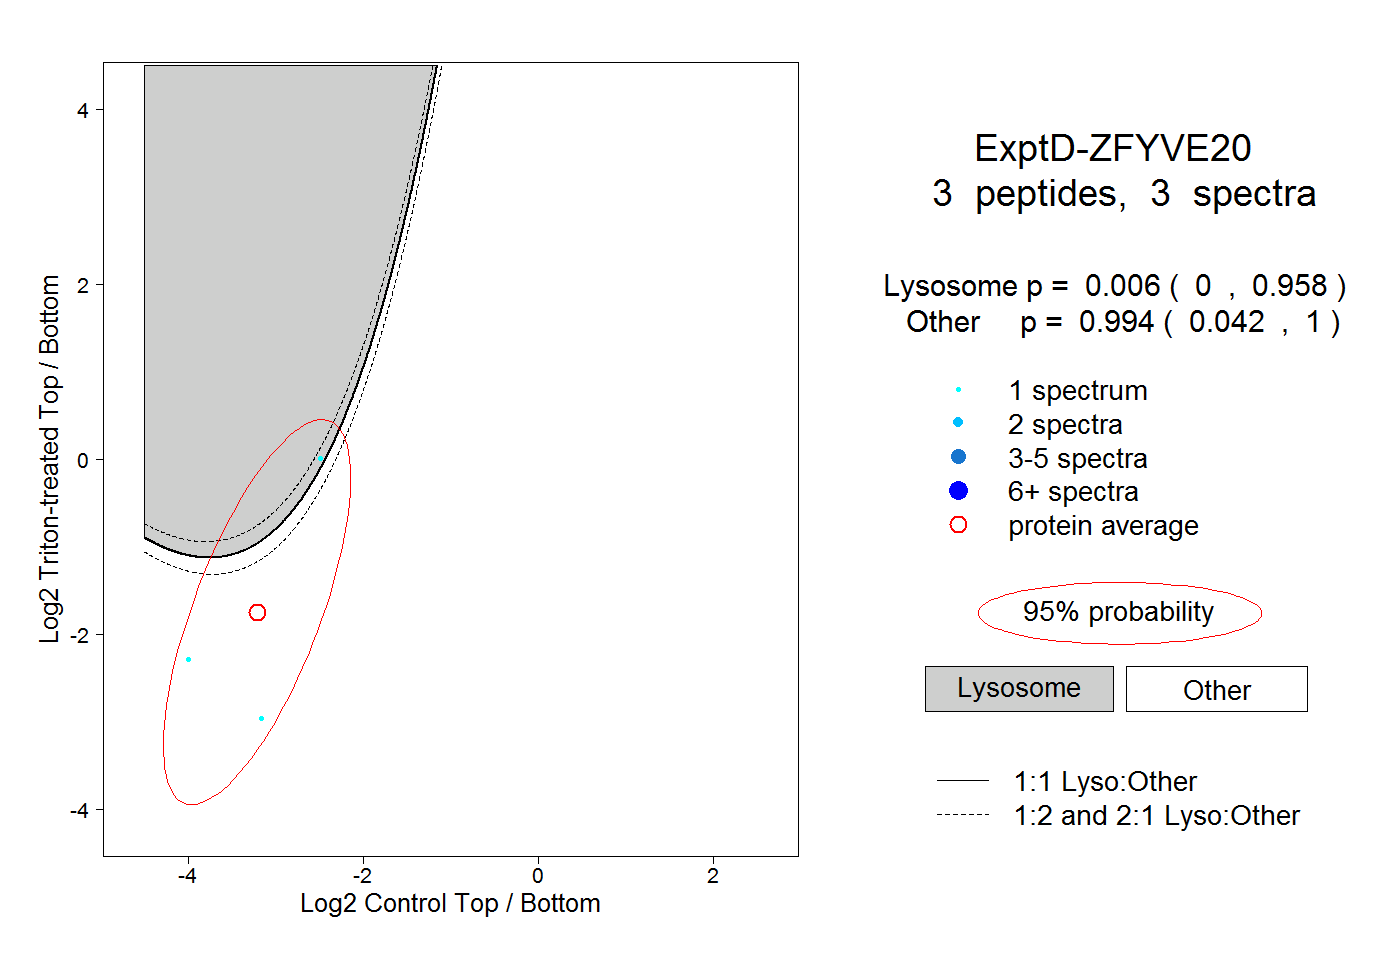
0.000 | 0.958
0.042 | 1.000