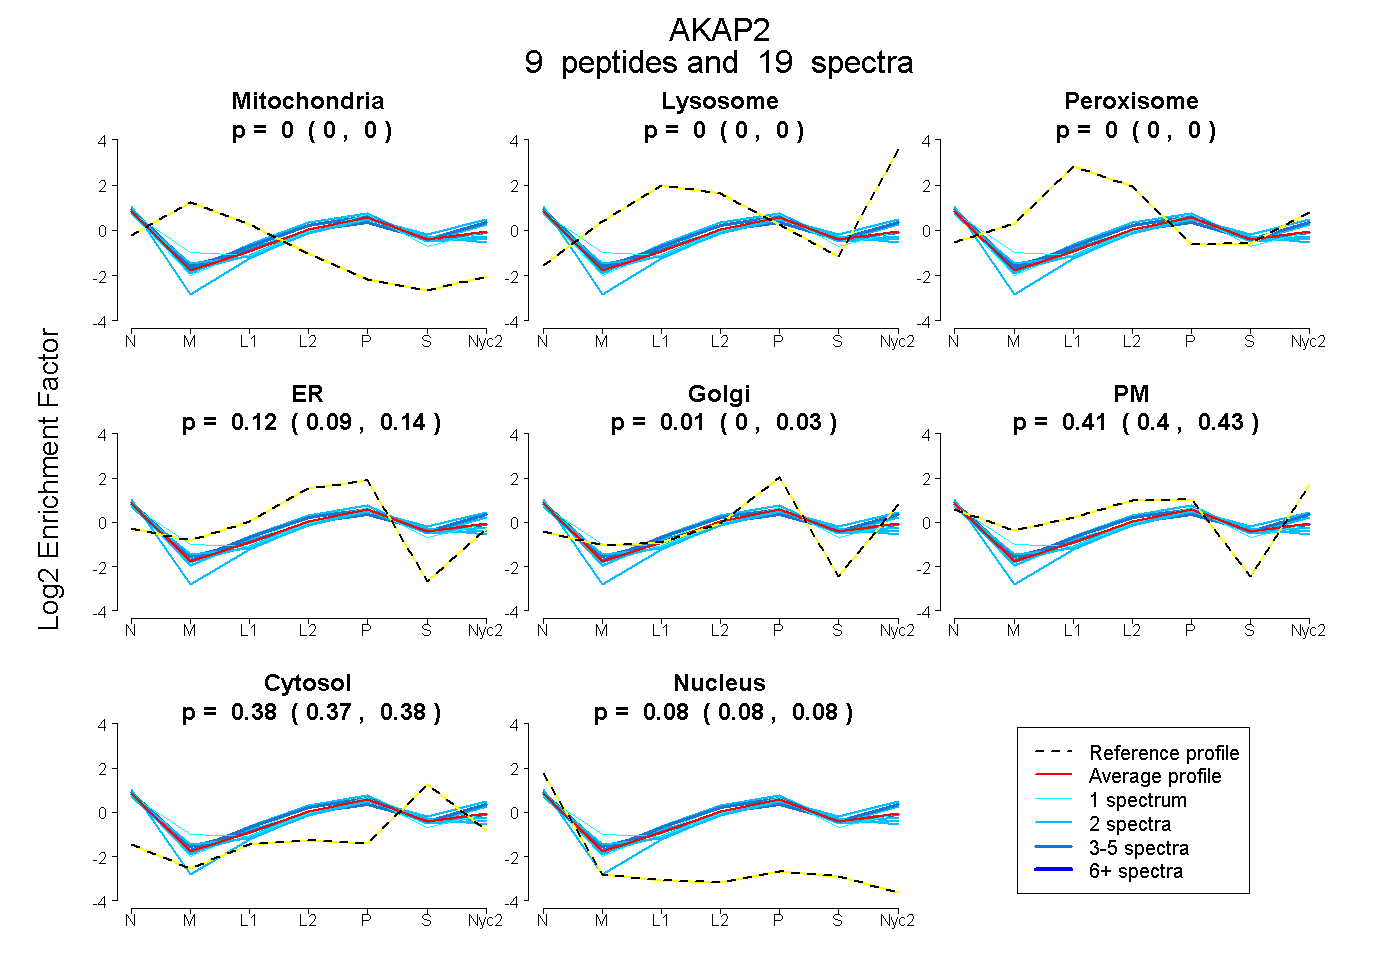
 9
9peptides
spectra
0.000 | 0.000
0.000 | 0.000
0.000 | 0.000
0.095 | 0.136
0.000 | 0.025
0.396 | 0.429
0.371 | 0.380
0.076 | 0.084
| Plot | Mito | Lyso | Perox | ER | Golgi | PM | Cytosol | Nucleus | |||||
| Expt A |
9 peptides |
19 spectra |
|
0.000 0.000 | 0.000 |
0.000 0.000 | 0.000 |
0.000 0.000 | 0.000 |
0.118 0.095 | 0.136 |
0.011 0.000 | 0.025 |
0.415 0.396 | 0.429 |
0.376 0.371 | 0.380 |
0.080 0.076 | 0.084 |
| 2 spectra, QSTPSPR | 0.000 | 0.000 | 0.000 | 0.140 | 0.000 | 0.467 | 0.358 | 0.035 | ||
| 1 spectrum, WWNPPQEK | 0.000 | 0.000 | 0.000 | 0.071 | 0.116 | 0.426 | 0.290 | 0.097 | ||
| 4 spectra, TLSMIEEEIR | 0.000 | 0.000 | 0.000 | 0.043 | 0.000 | 0.542 | 0.380 | 0.034 | ||
| 3 spectra, ILPGEDK | 0.000 | 0.000 | 0.000 | 0.061 | 0.000 | 0.470 | 0.374 | 0.095 | ||
| 2 spectra, ETRPEGGYFSK | 0.000 | 0.000 | 0.000 | 0.158 | 0.000 | 0.369 | 0.367 | 0.106 | ||
| 2 spectra, LWAEDGEFTSAR | 0.000 | 0.000 | 0.000 | 0.158 | 0.106 | 0.218 | 0.368 | 0.149 | ||
| 2 spectra, VRPSEEMIELEK | 0.000 | 0.000 | 0.000 | 0.204 | 0.007 | 0.284 | 0.394 | 0.111 | ||
| 2 spectra, LFEEDEHEK | 0.000 | 0.000 | 0.000 | 0.000 | 0.074 | 0.468 | 0.430 | 0.029 | ||
| 1 spectrum, EGPYSEPSK | 0.000 | 0.000 | 0.000 | 0.281 | 0.000 | 0.269 | 0.379 | 0.071 |
| Plot | Lyso | Other | |||||||||||
| Expt C |
7 peptides |
13 spectra |
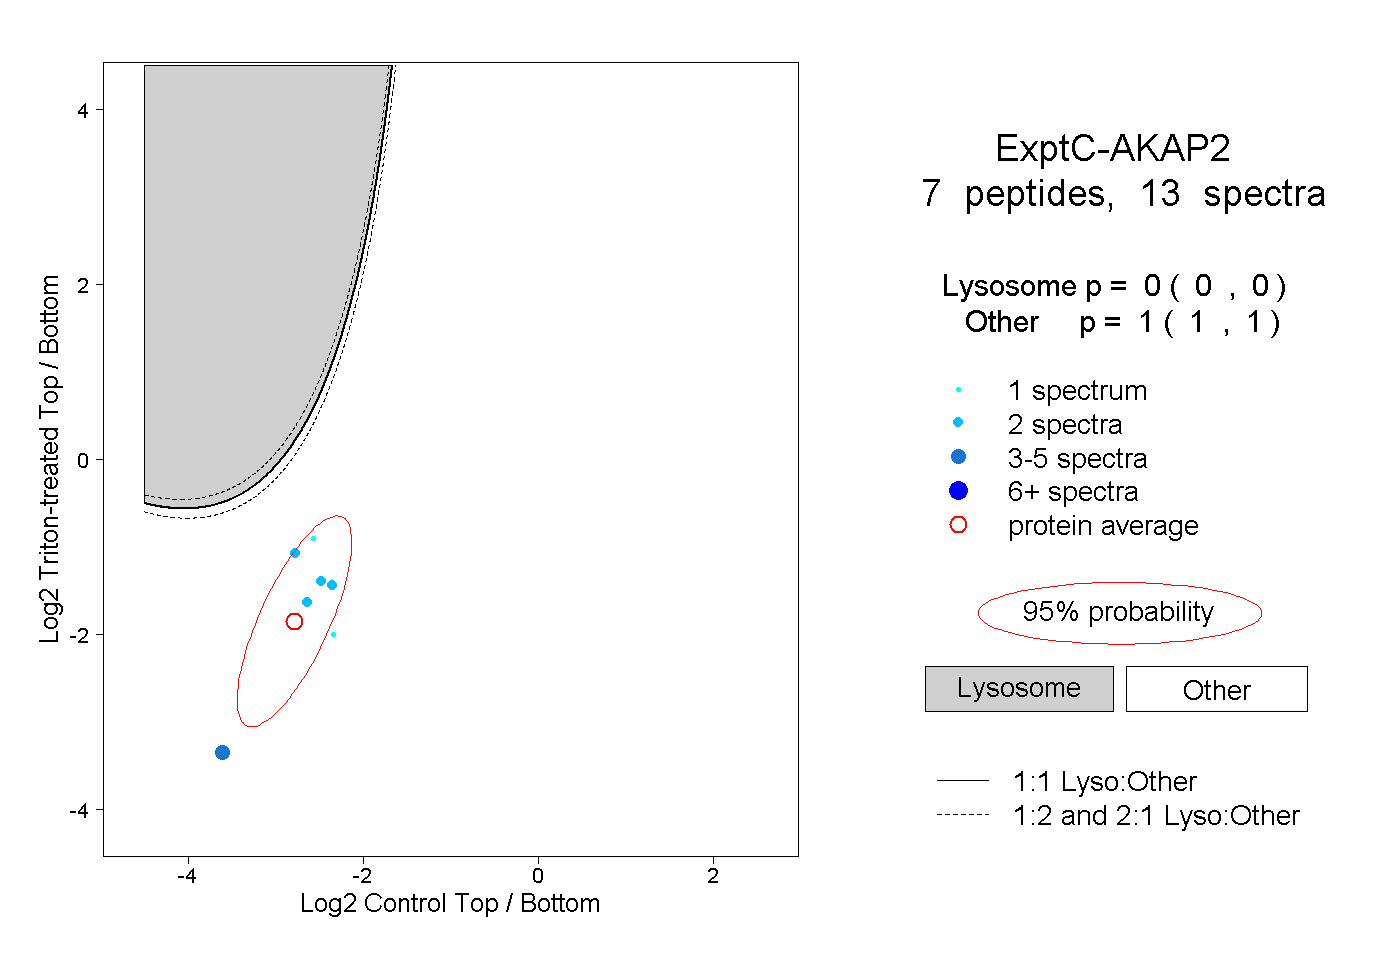 |
0.000 0.000 | 0.000 |
1.000 1.000 | 1.000 |
||||||||
| Plot | Lyso | Other | |||||||||||
| Expt D |
2 peptides |
2 spectra |
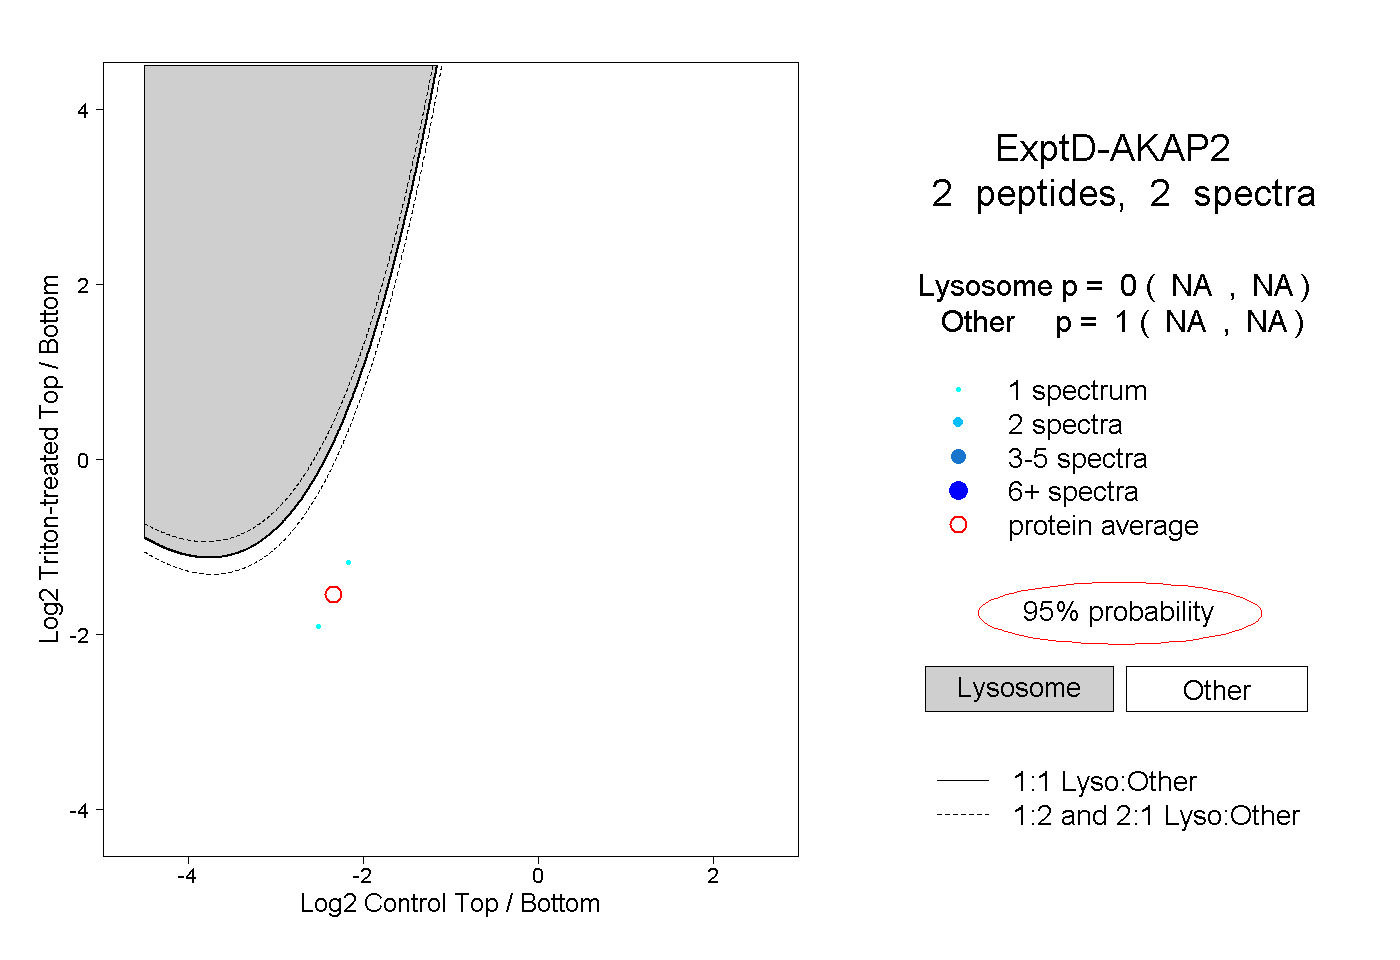 |
0.000 NA | NA |
1.000 NA | NA |