 9
9peptides
spectra
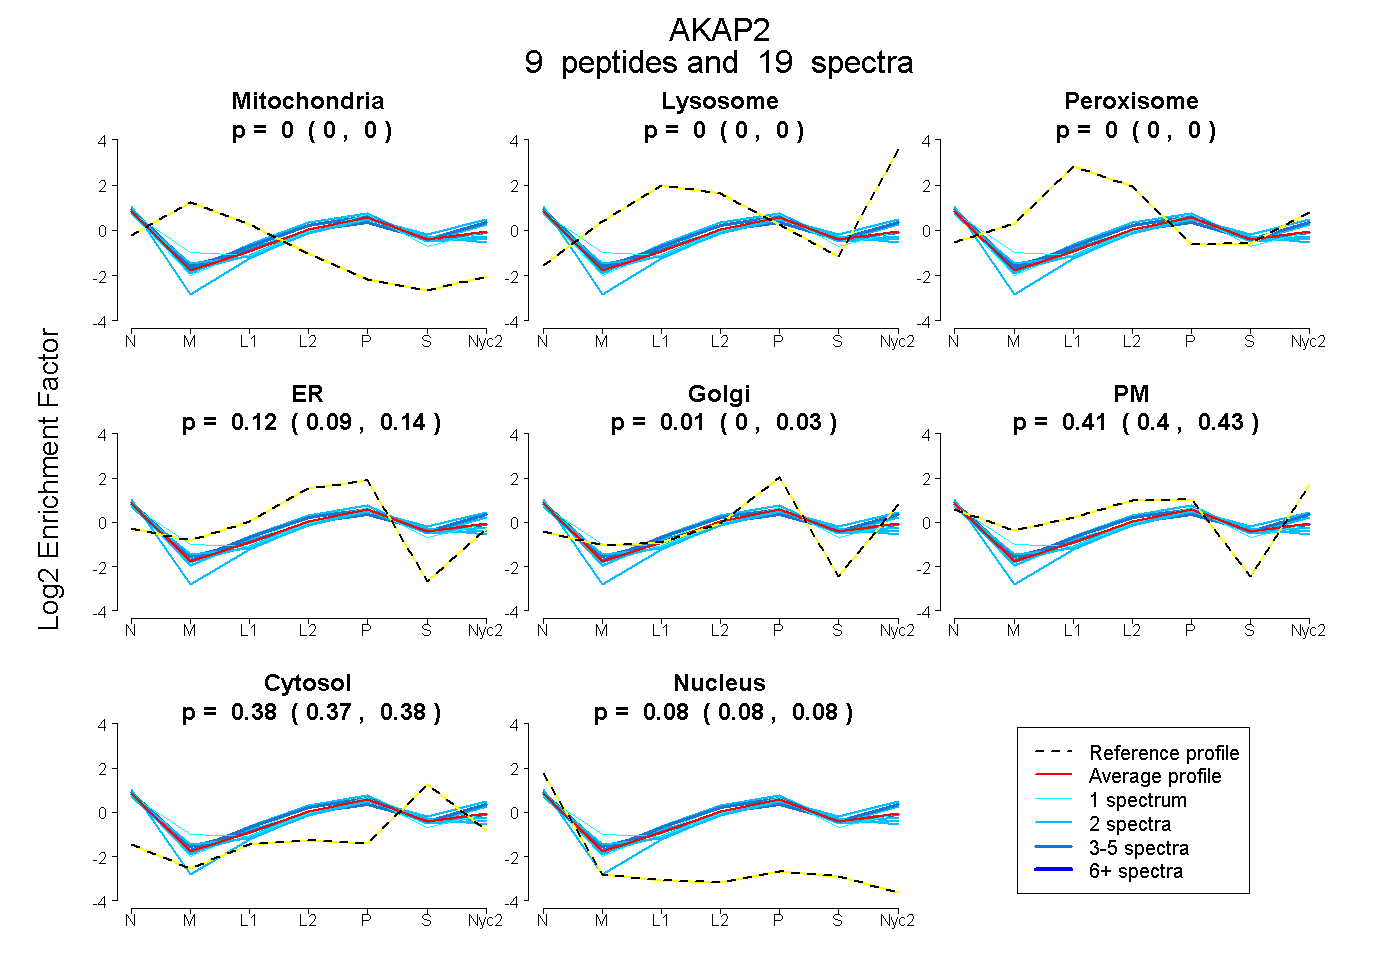
0.000 | 0.000
0.000 | 0.000
0.000 | 0.000
0.095 | 0.136
0.000 | 0.025
0.396 | 0.429
0.371 | 0.380
0.076 | 0.084
7peptides
spectra
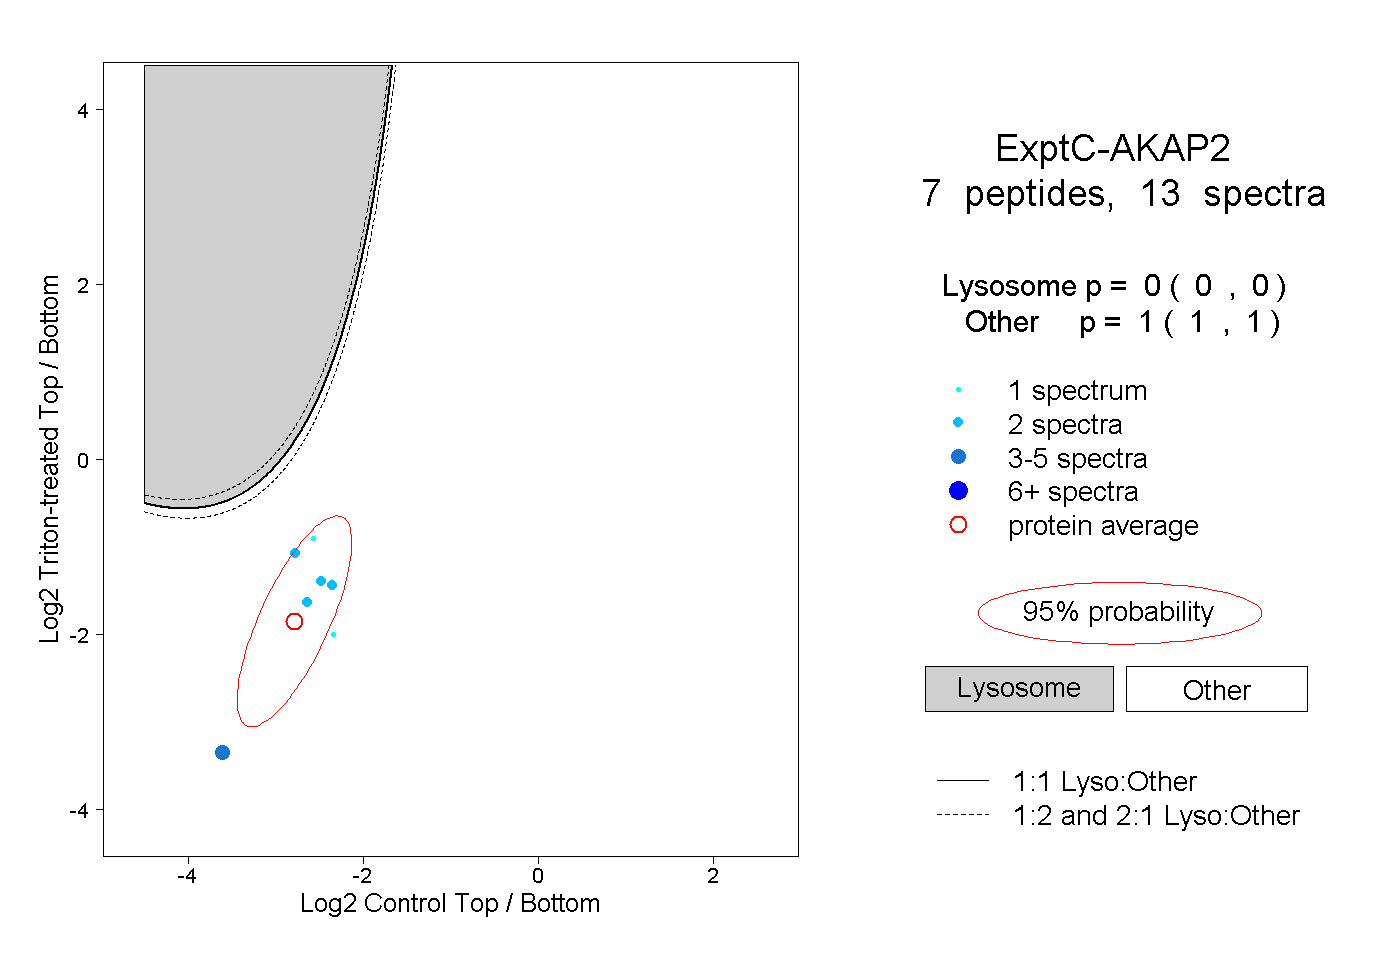
0.000 | 0.000
1.000 | 1.000
2peptides
spectra
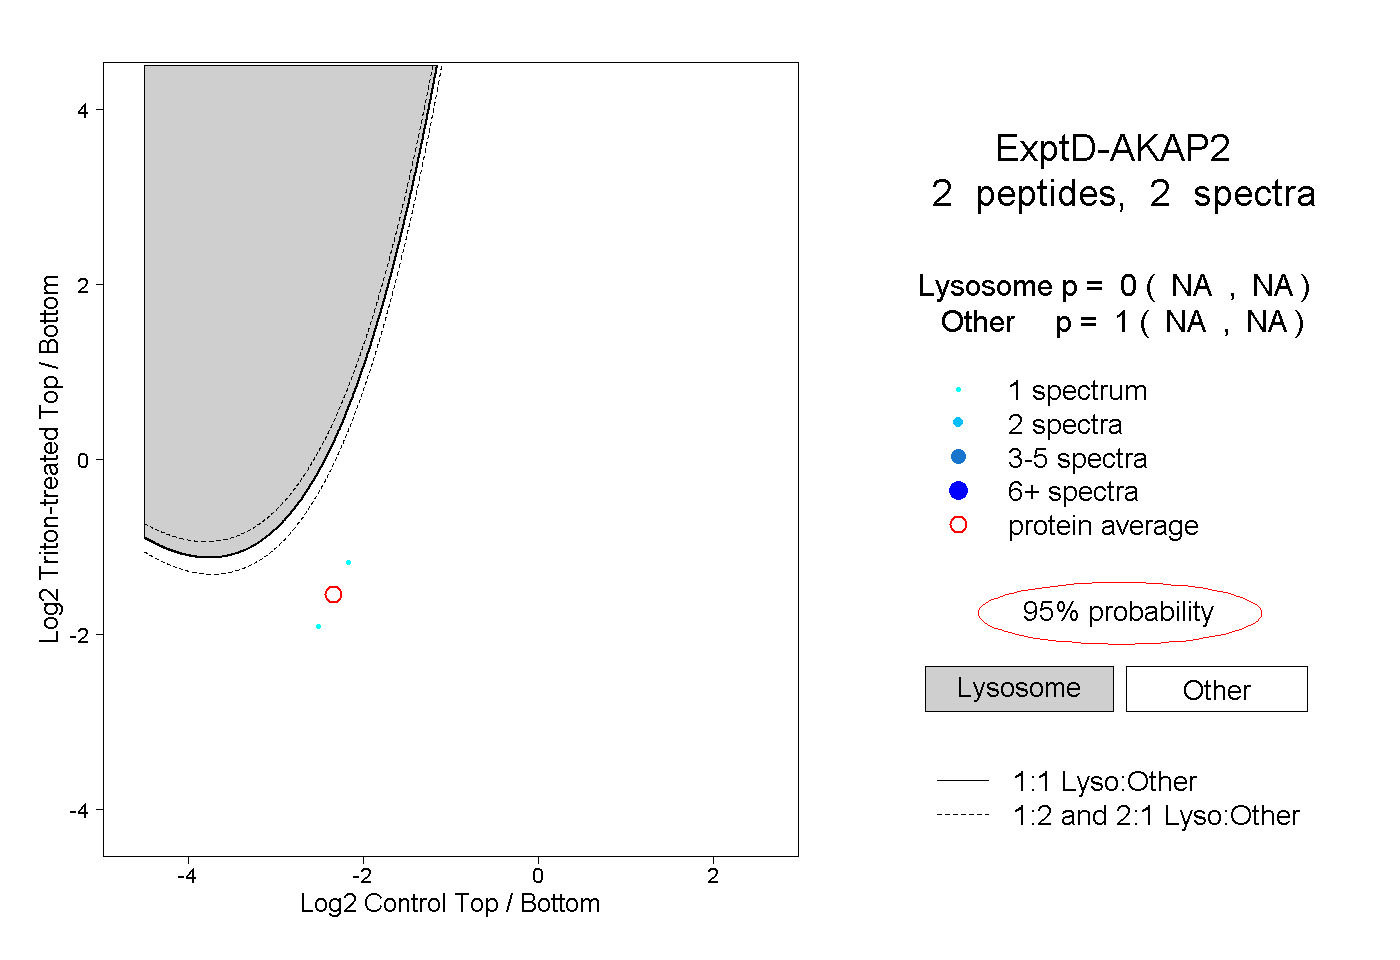
NA | NA
NA | NA