 4
4peptides
spectra
0.000 | 0.000
0.000 | 0.120
0.000 | 0.082
0.000 | 0.100
0.000 | 0.151
0.000 | 0.075
0.765 | 0.893
0.000 | 0.000
1peptide
spectra
NA | NA
NA | NA
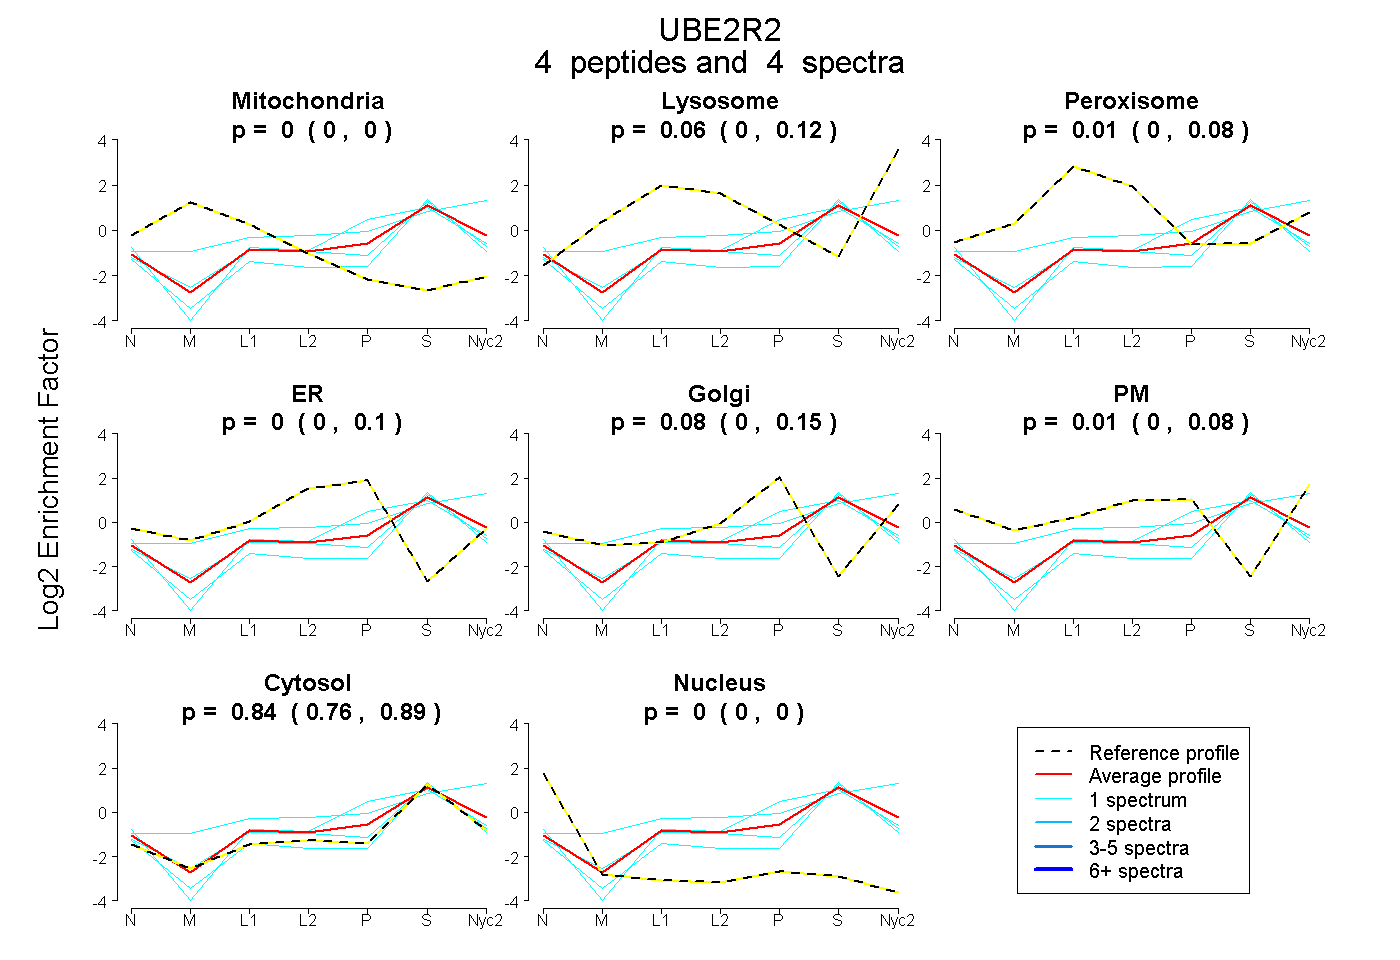
| Plot | Mito | Lyso | Perox | ER | Golgi | PM | Cytosol | Nucleus | |||||
| Expt A |
4 peptides |
4 spectra |
|
0.000 0.000 | 0.000 |
0.058 0.000 | 0.120 |
0.012 0.000 | 0.082 |
0.000 0.000 | 0.100 |
0.083 0.000 | 0.151 |
0.009 0.000 | 0.075 |
0.838 0.765 | 0.893 |
0.000 0.000 | 0.000 |
||
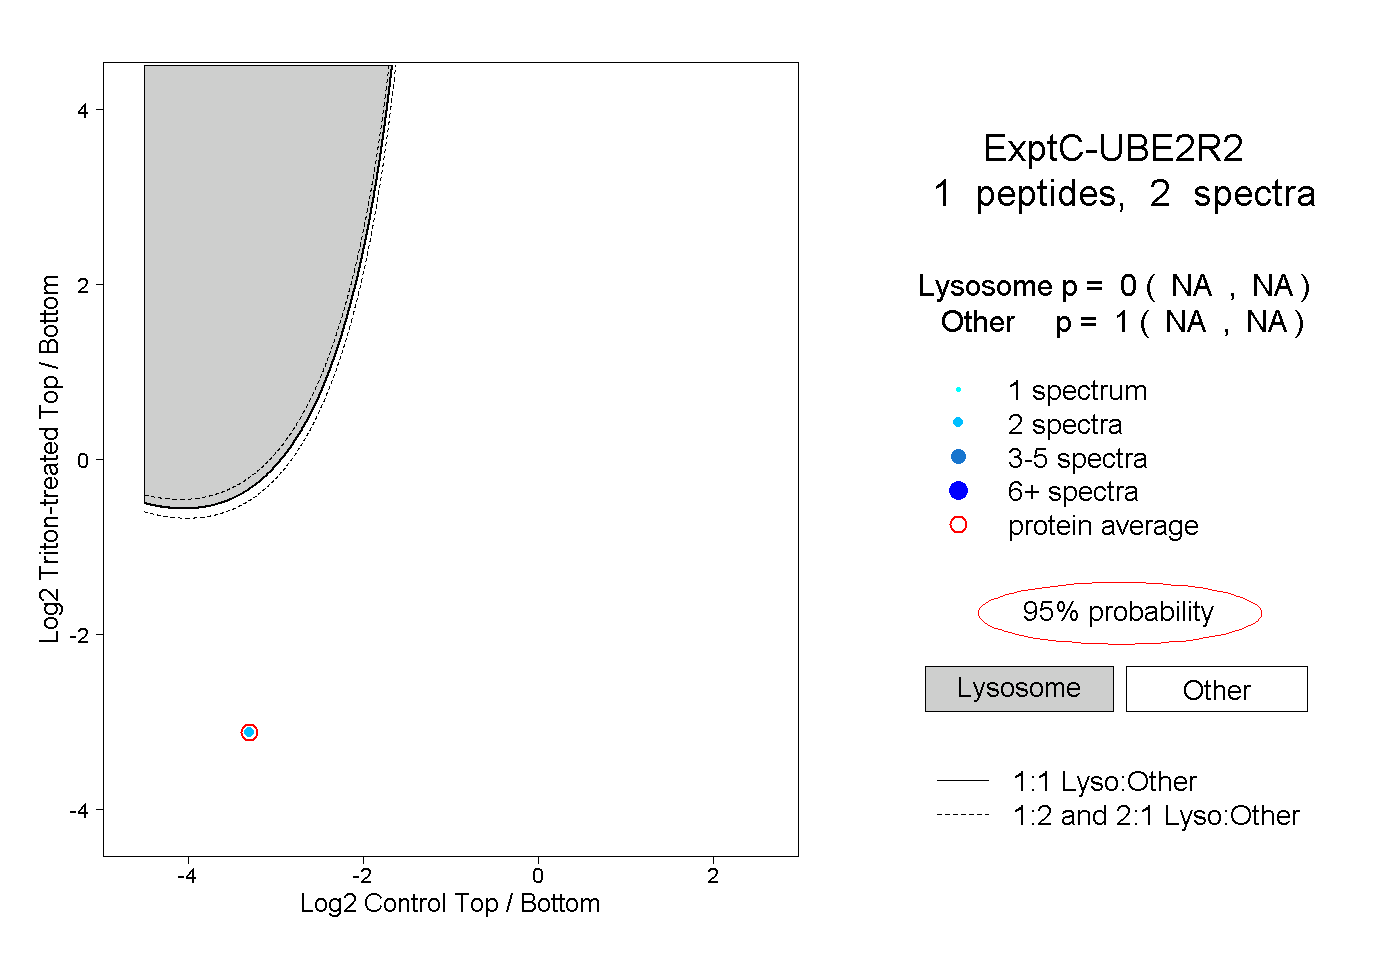
| Plot | Lyso | Other | |||||||||||
| Expt C |
1 peptide |
2 spectra |
|
0.000 NA | NA |
1.000 NA | NA |