 7
7peptides
spectra
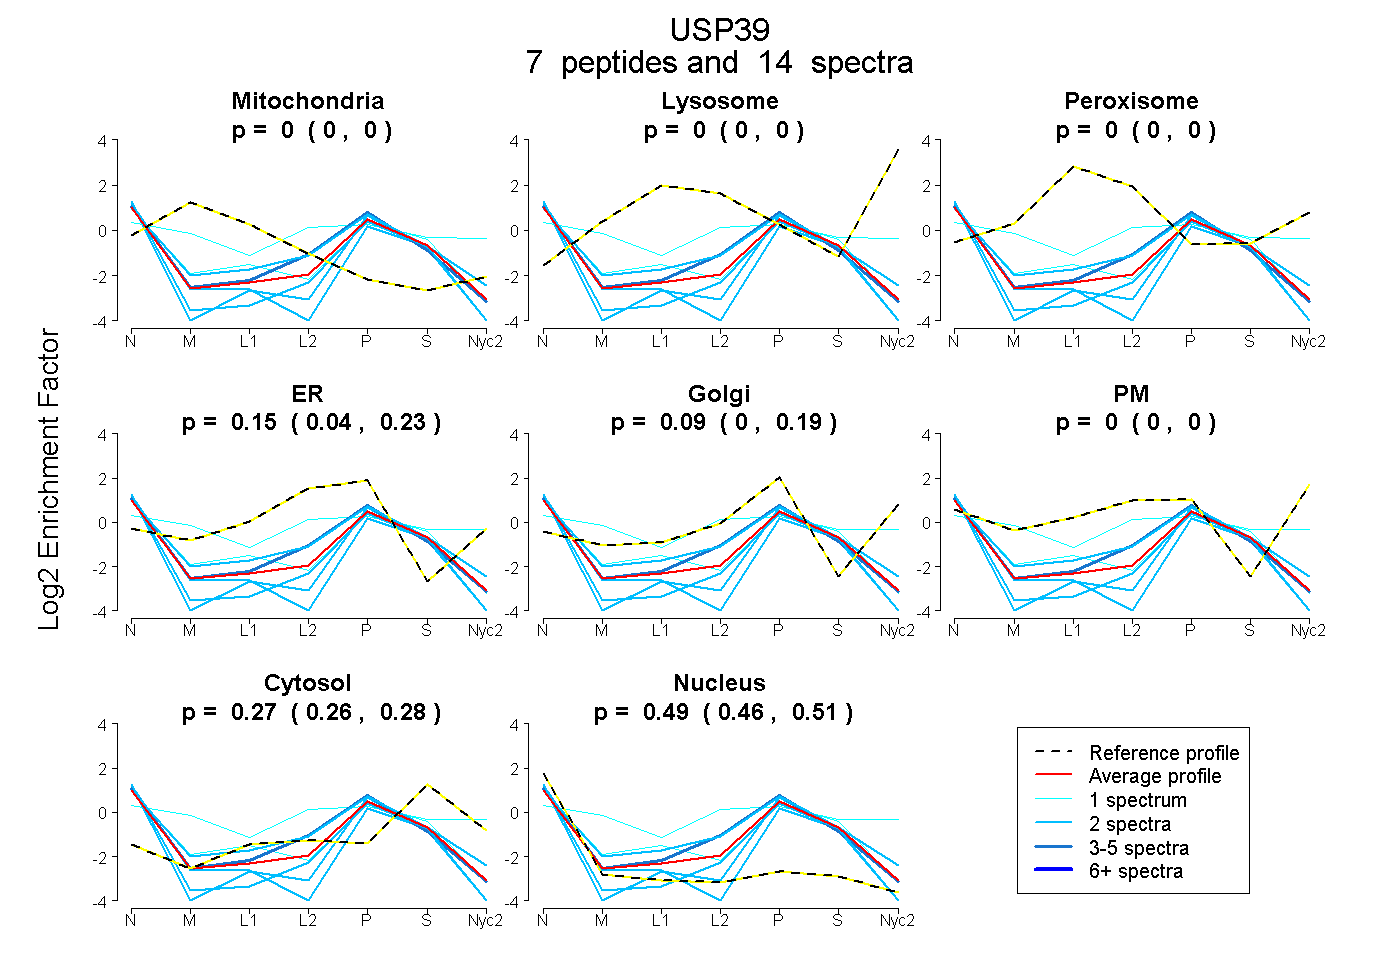
0.000 | 0.000
0.000 | 0.000
0.000 | 0.000
0.040 | 0.232
0.000 | 0.188
0.000 | 0.000
0.262 | 0.285
0.463 | 0.506
| Plot | Mito | Lyso | Perox | ER | Golgi | PM | Cytosol | Nucleus | |||||
| Expt A |
7 peptides |
14 spectra |
|
0.000 0.000 | 0.000 |
0.000 0.000 | 0.000 |
0.000 0.000 | 0.000 |
0.149 0.040 | 0.232 |
0.090 0.000 | 0.188 |
0.000 0.000 | 0.000 |
0.274 0.262 | 0.285 |
0.487 0.463 | 0.506 |
| 2 spectra, TIVNDVFQGSMR | 0.000 | 0.000 | 0.000 | 0.371 | 0.005 | 0.000 | 0.267 | 0.356 | ||
| 2 spectra, EYLSEEVQAVHK | 0.000 | 0.000 | 0.000 | 0.000 | 0.055 | 0.000 | 0.245 | 0.700 | ||
| 2 spectra, EAEPTPR | 0.000 | 0.000 | 0.000 | 0.000 | 0.092 | 0.000 | 0.248 | 0.661 | ||
| 1 spectrum, HCPYLDTINR | 0.138 | 0.000 | 0.000 | 0.143 | 0.000 | 0.346 | 0.373 | 0.000 | ||
| 2 spectra, SVLDFDFEK | 0.000 | 0.000 | 0.000 | 0.050 | 0.043 | 0.000 | 0.254 | 0.652 | ||
| 4 spectra, RPPGDIMFLLVQR | 0.000 | 0.000 | 0.000 | 0.339 | 0.000 | 0.000 | 0.213 | 0.448 | ||
| 1 spectrum, NYFLEEDNYK | 0.000 | 0.000 | 0.000 | 0.238 | 0.000 | 0.000 | 0.317 | 0.445 |
| Plot | Mito | Lyso or Perox | ER | Golgi | PM | Cytosol | Nucleus | ||||||
| Expt B |
1 peptide |
4 spectra |
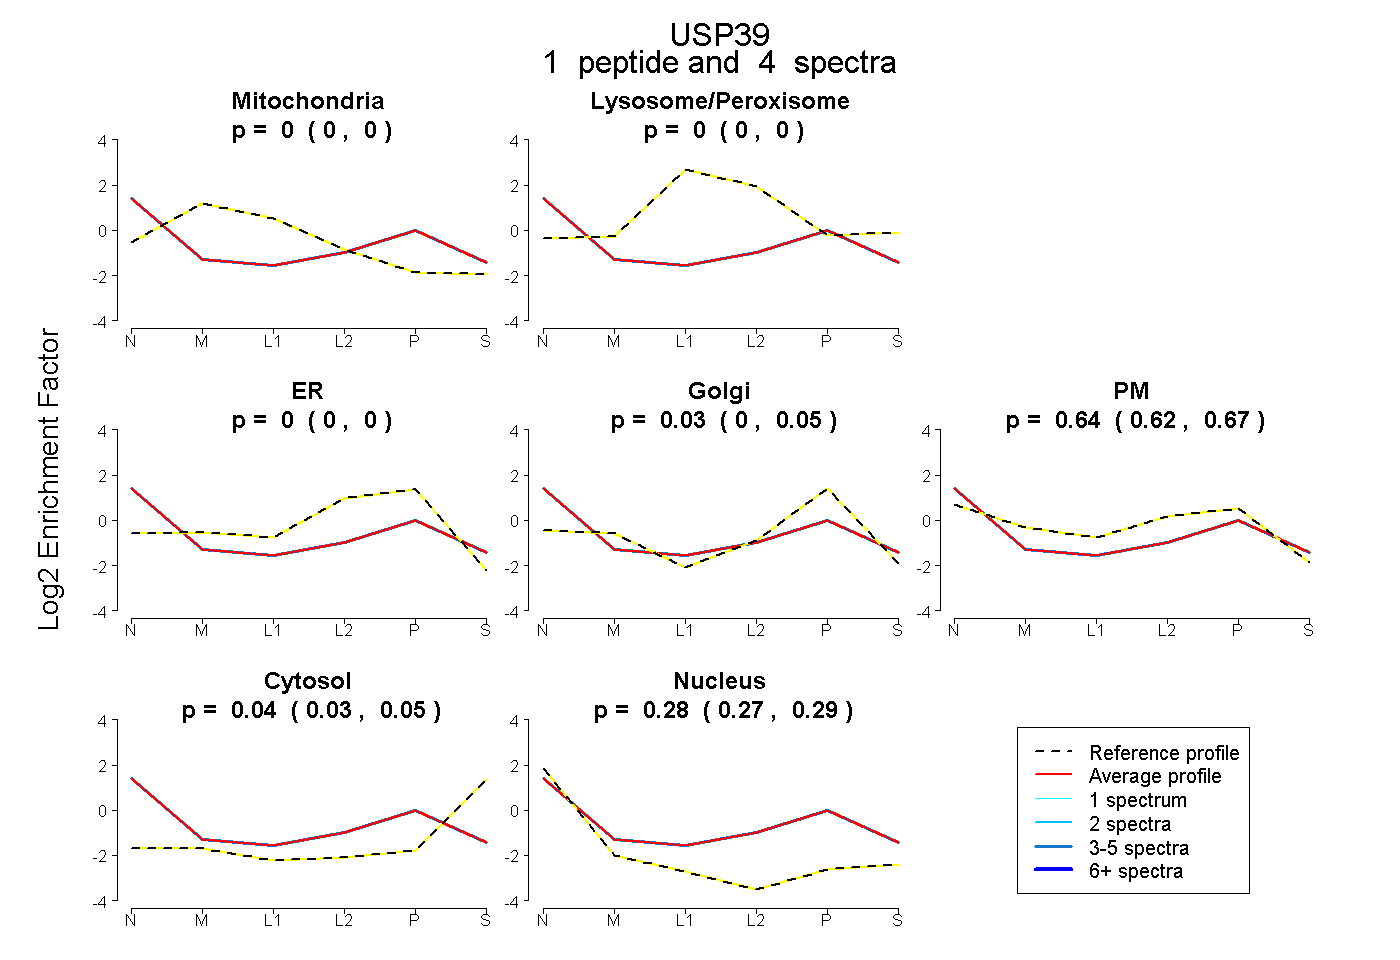 |
0.000 0.000 | 0.000 |
0.000 0.000 | 0.000 |
0.000 0.000 | 0.000 |
0.029 0.000 | 0.055 |
0.645 0.618 | 0.667 |
0.043 0.033 | 0.053 |
0.282 0.272 | 0.291 |
|||
| Plot | Lyso | Other | |||||||||||
| Expt C |
2 peptides |
2 spectra |
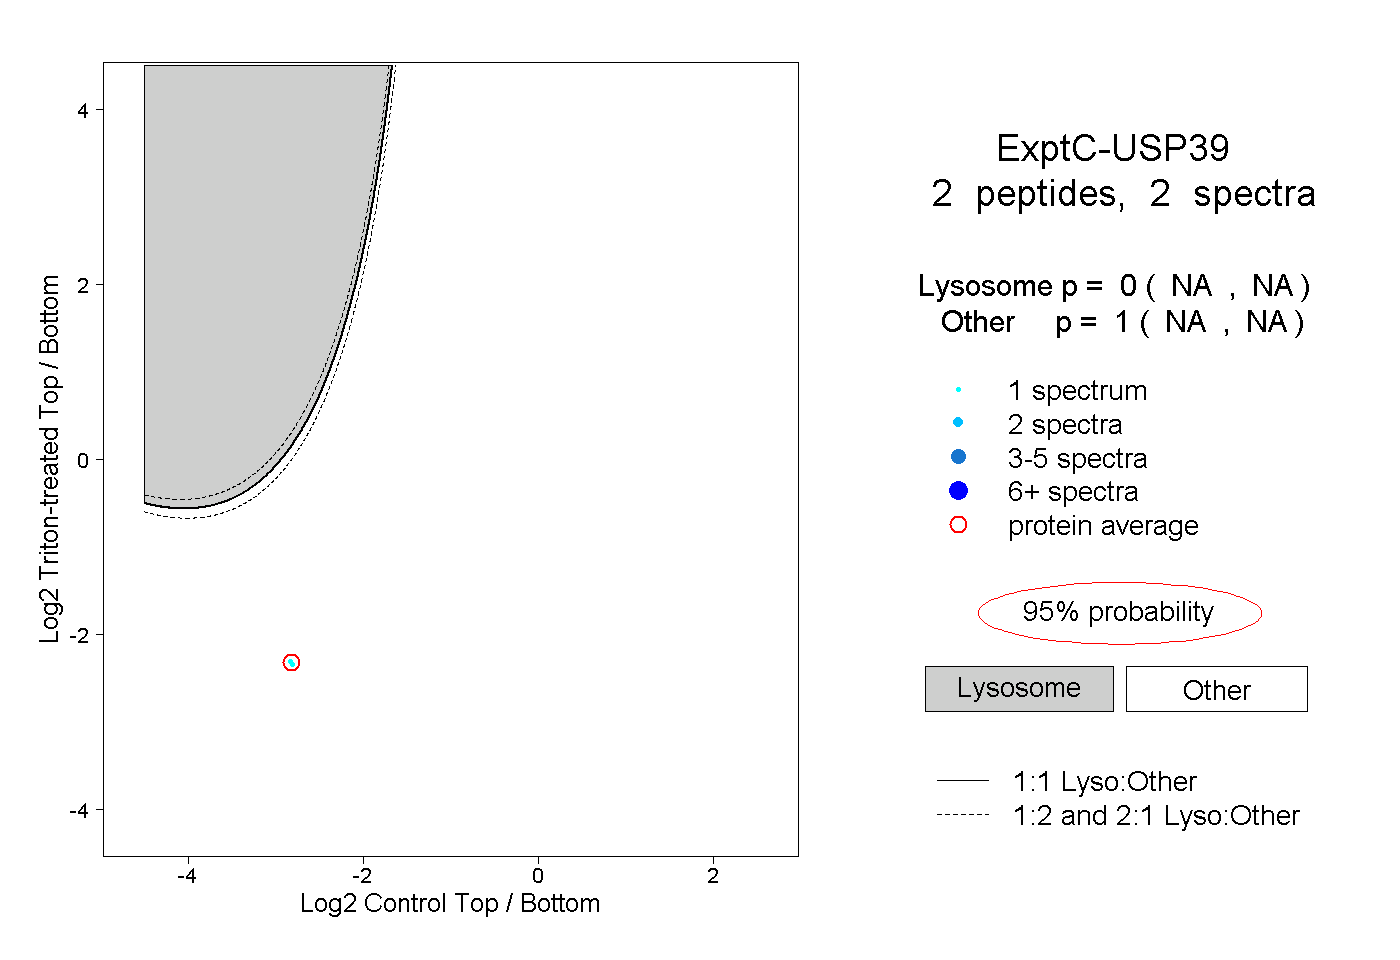 |
0.000 NA | NA |
1.000 NA | NA |