20
20peptides
spectra
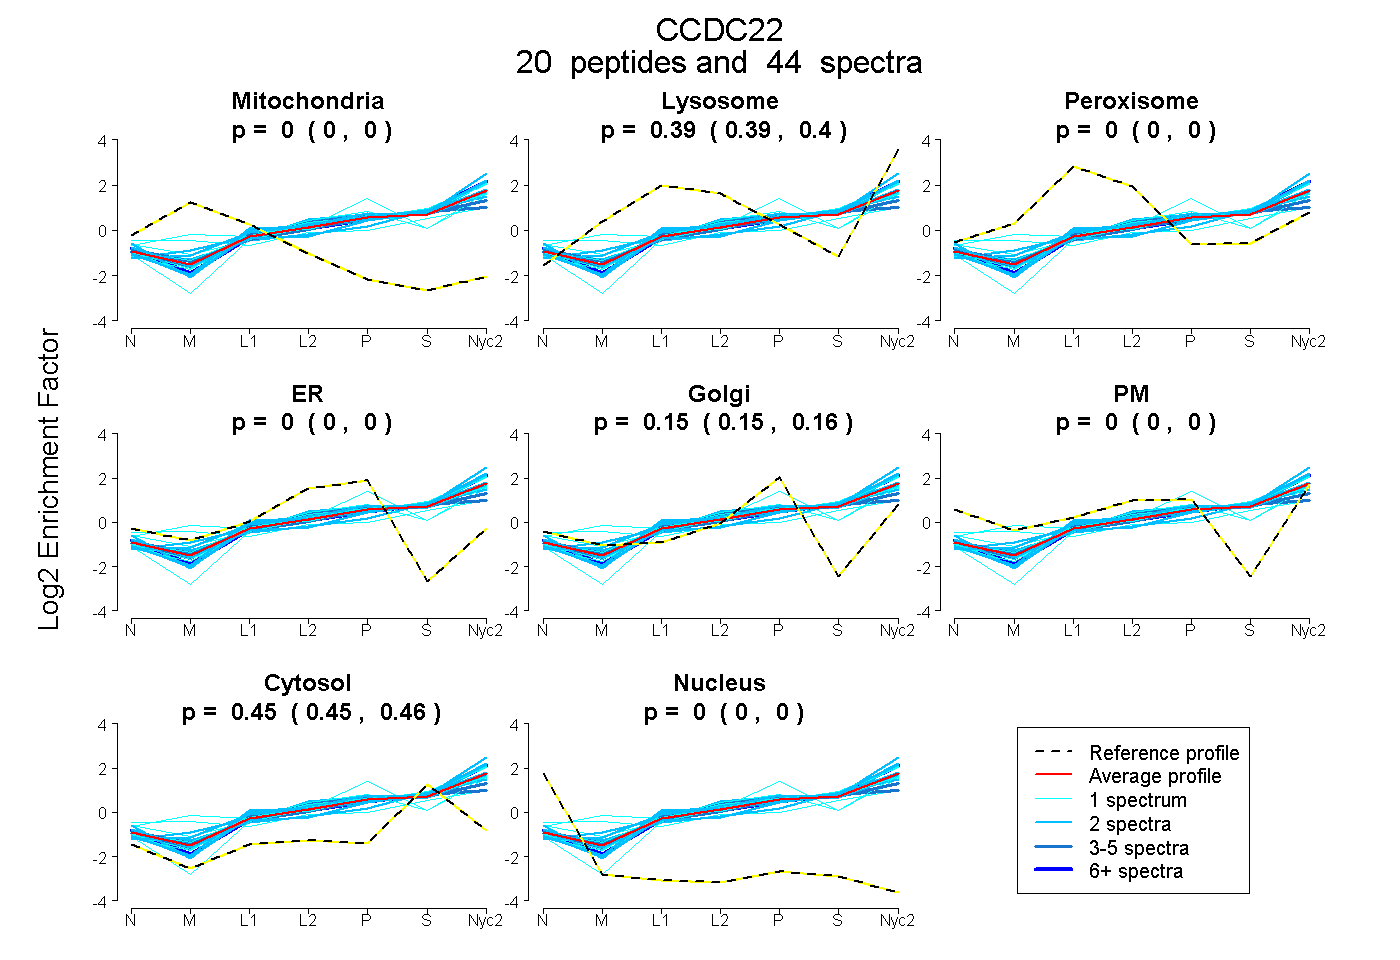
0.000 | 0.000
0.389 | 0.396
0.000 | 0.000
0.000 | 0.000
0.149 | 0.156
0.000 | 0.000
0.451 | 0.457
0.000 | 0.000
11peptides
spectra
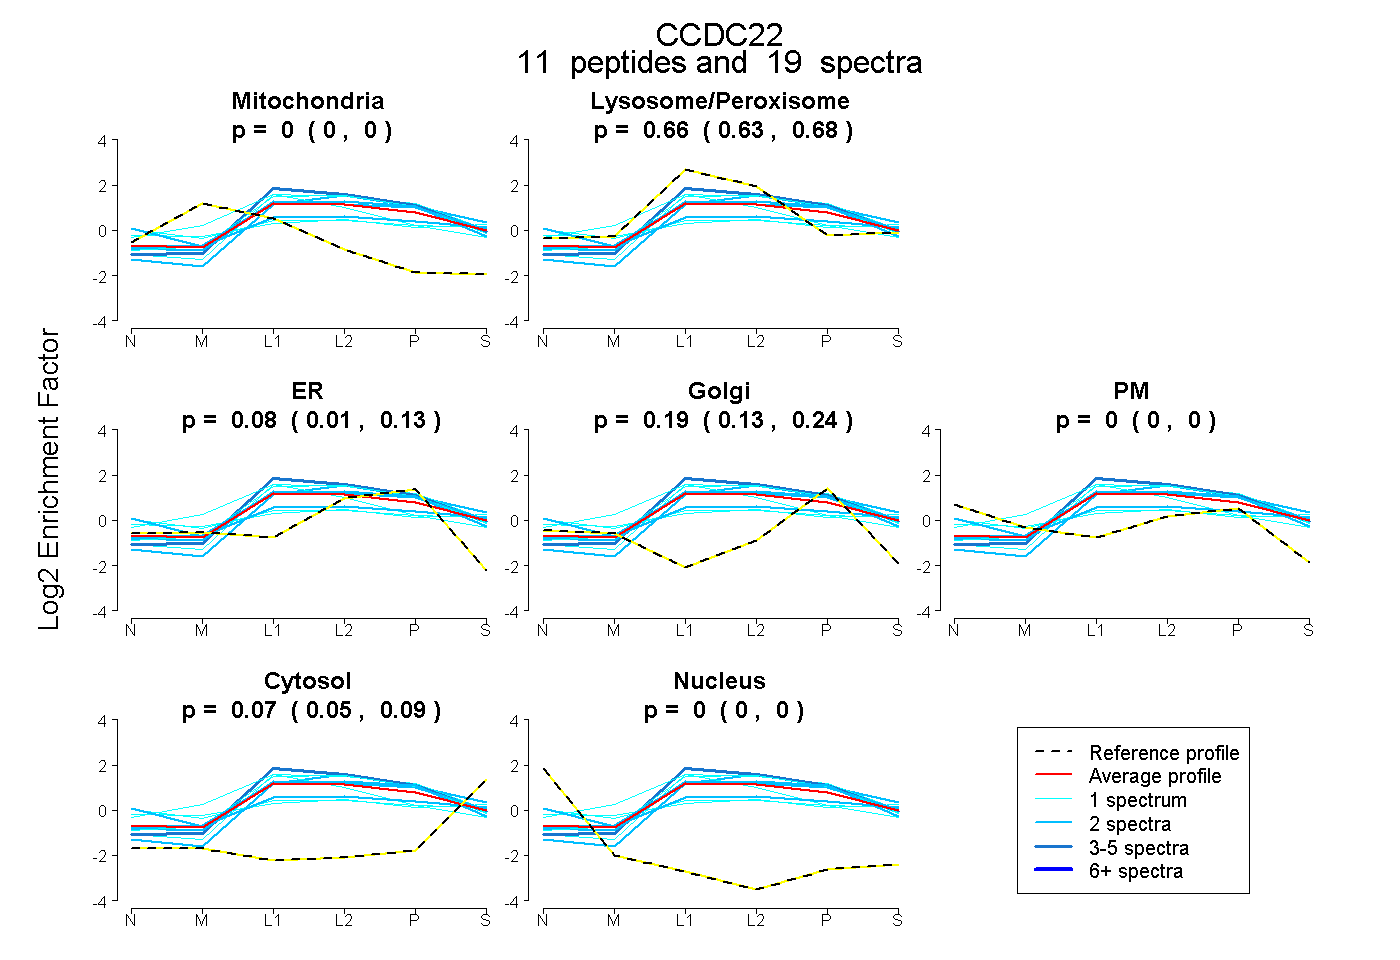
0.000 | 0.000
0.634 | 0.682
0.009 | 0.133
0.131 | 0.243
0.000 | 0.000
0.051 | 0.087
0.000 | 0.000