 20
20peptides
spectra
0.000 | 0.000
0.389 | 0.396
0.000 | 0.000
0.000 | 0.000
0.149 | 0.156
0.000 | 0.000
0.451 | 0.457
0.000 | 0.000
| Plot | Mito | Lyso | Perox | ER | Golgi | PM | Cytosol | Nucleus | |||||
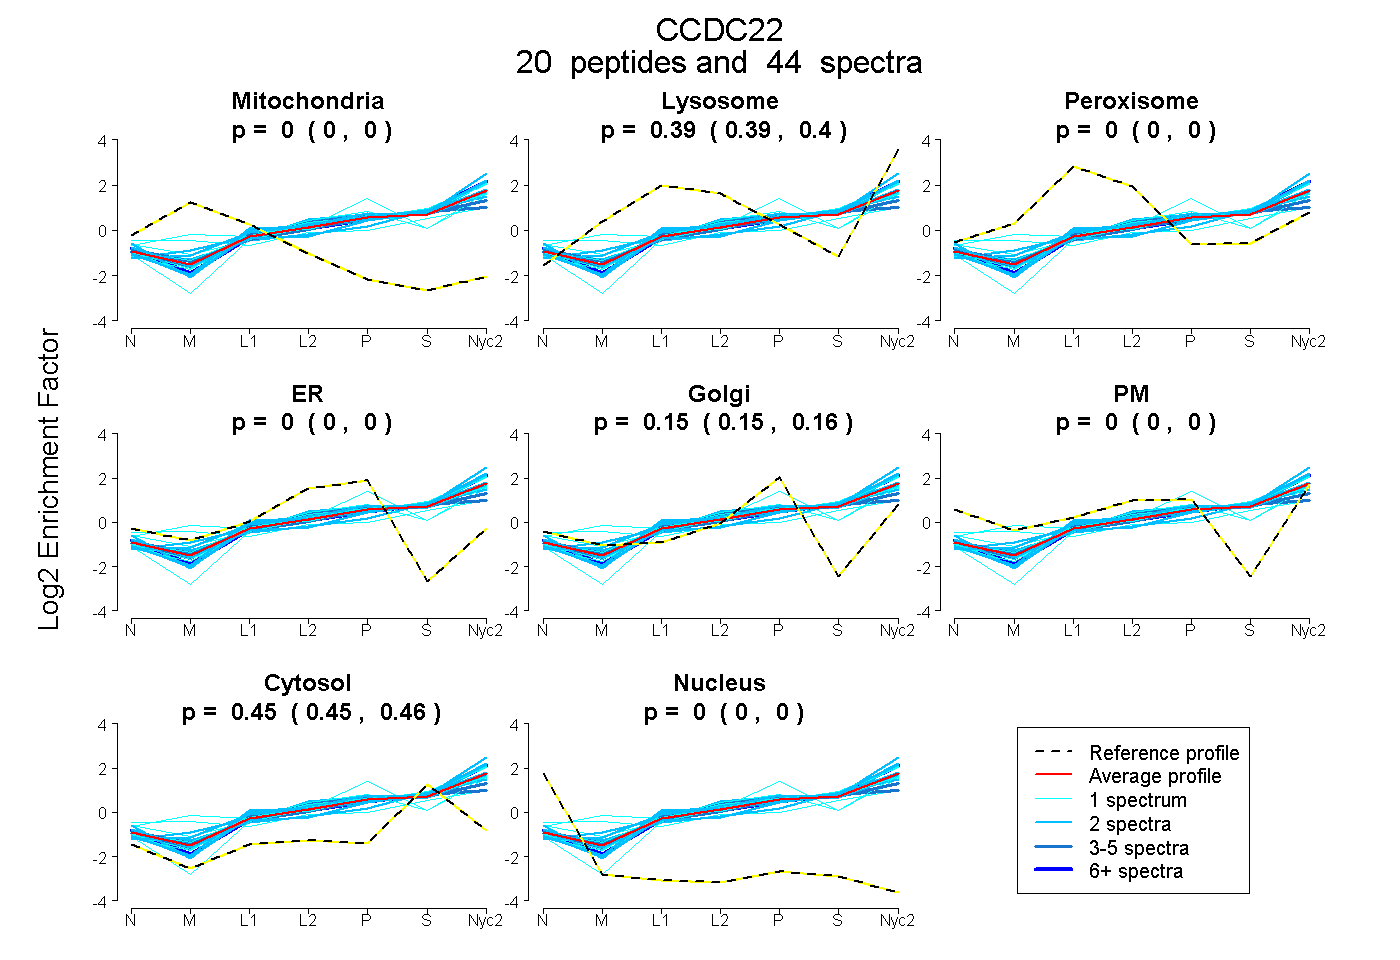
| Expt A |
20 peptides |
44 spectra |
|
0.000 0.000 | 0.000 |
0.393 0.389 | 0.396 |
0.000 0.000 | 0.000 |
0.000 0.000 | 0.000 |
0.153 0.149 | 0.156 |
0.000 0.000 | 0.000 |
0.455 0.451 | 0.457 |
0.000 0.000 | 0.000 |
| 4 spectra, LVLPELNCR | 0.000 | 0.330 | 0.000 | 0.000 | 0.192 | 0.000 | 0.478 | 0.000 | ||
| 2 spectra, LQLVVESSAQR | 0.000 | 0.481 | 0.000 | 0.000 | 0.117 | 0.000 | 0.403 | 0.000 | ||
| 7 spectra, AAQEEELESLR | 0.000 | 0.407 | 0.000 | 0.000 | 0.119 | 0.000 | 0.475 | 0.000 | ||
| 1 spectrum, LYYETPR | 0.000 | 0.398 | 0.000 | 0.000 | 0.141 | 0.000 | 0.461 | 0.000 | ||
| 1 spectrum, QLIEHLR | 0.000 | 0.413 | 0.000 | 0.000 | 0.118 | 0.000 | 0.469 | 0.000 | ||
| 2 spectra, AFTTELVVEAVVR | 0.000 | 0.373 | 0.000 | 0.000 | 0.107 | 0.000 | 0.520 | 0.000 | ||
| 1 spectrum, QLVSELETLPK | 0.000 | 0.355 | 0.000 | 0.000 | 0.108 | 0.000 | 0.537 | 0.000 | ||
| 2 spectra, LAYTQR | 0.000 | 0.372 | 0.000 | 0.000 | 0.095 | 0.000 | 0.533 | 0.000 | ||
| 4 spectra, ICEDYR | 0.000 | 0.325 | 0.000 | 0.000 | 0.158 | 0.000 | 0.517 | 0.000 | ||
| 1 spectrum, QSWGPLGAPTQVR | 0.000 | 0.394 | 0.000 | 0.000 | 0.156 | 0.000 | 0.450 | 0.000 | ||
| 1 spectrum, EINSLSGK | 0.000 | 0.288 | 0.000 | 0.000 | 0.424 | 0.000 | 0.288 | 0.000 | ||
| 2 spectra, TVELLPDGAANLTK | 0.000 | 0.463 | 0.000 | 0.000 | 0.073 | 0.000 | 0.464 | 0.000 | ||
| 1 spectrum, SLGMNLVQVETECR | 0.000 | 0.383 | 0.000 | 0.000 | 0.125 | 0.000 | 0.493 | 0.000 | ||
| 2 spectra, ILEIVGNIR | 0.000 | 0.492 | 0.000 | 0.000 | 0.112 | 0.000 | 0.397 | 0.000 | ||
| 1 spectrum, DLEEQIETEMGK | 0.000 | 0.220 | 0.000 | 0.000 | 0.000 | 0.279 | 0.501 | 0.000 | ||
| 1 spectrum, LQGSALQQAFHSSR | 0.000 | 0.397 | 0.000 | 0.000 | 0.223 | 0.093 | 0.288 | 0.000 | ||
| 5 spectra, ILIHSLR | 0.000 | 0.395 | 0.000 | 0.000 | 0.161 | 0.000 | 0.444 | 0.000 | ||
| 2 spectra, VPLLAEYR | 0.000 | 0.362 | 0.000 | 0.000 | 0.149 | 0.000 | 0.489 | 0.000 | ||
| 2 spectra, TFAVTDELVFK | 0.000 | 0.511 | 0.000 | 0.000 | 0.058 | 0.000 | 0.431 | 0.000 | ||
| 2 spectra, QENAGLLGR | 0.000 | 0.346 | 0.000 | 0.000 | 0.174 | 0.029 | 0.450 | 0.000 |
| Plot | Mito | Lyso or Perox | ER | Golgi | PM | Cytosol | Nucleus | ||||||
| Expt B |
11 peptides |
19 spectra |
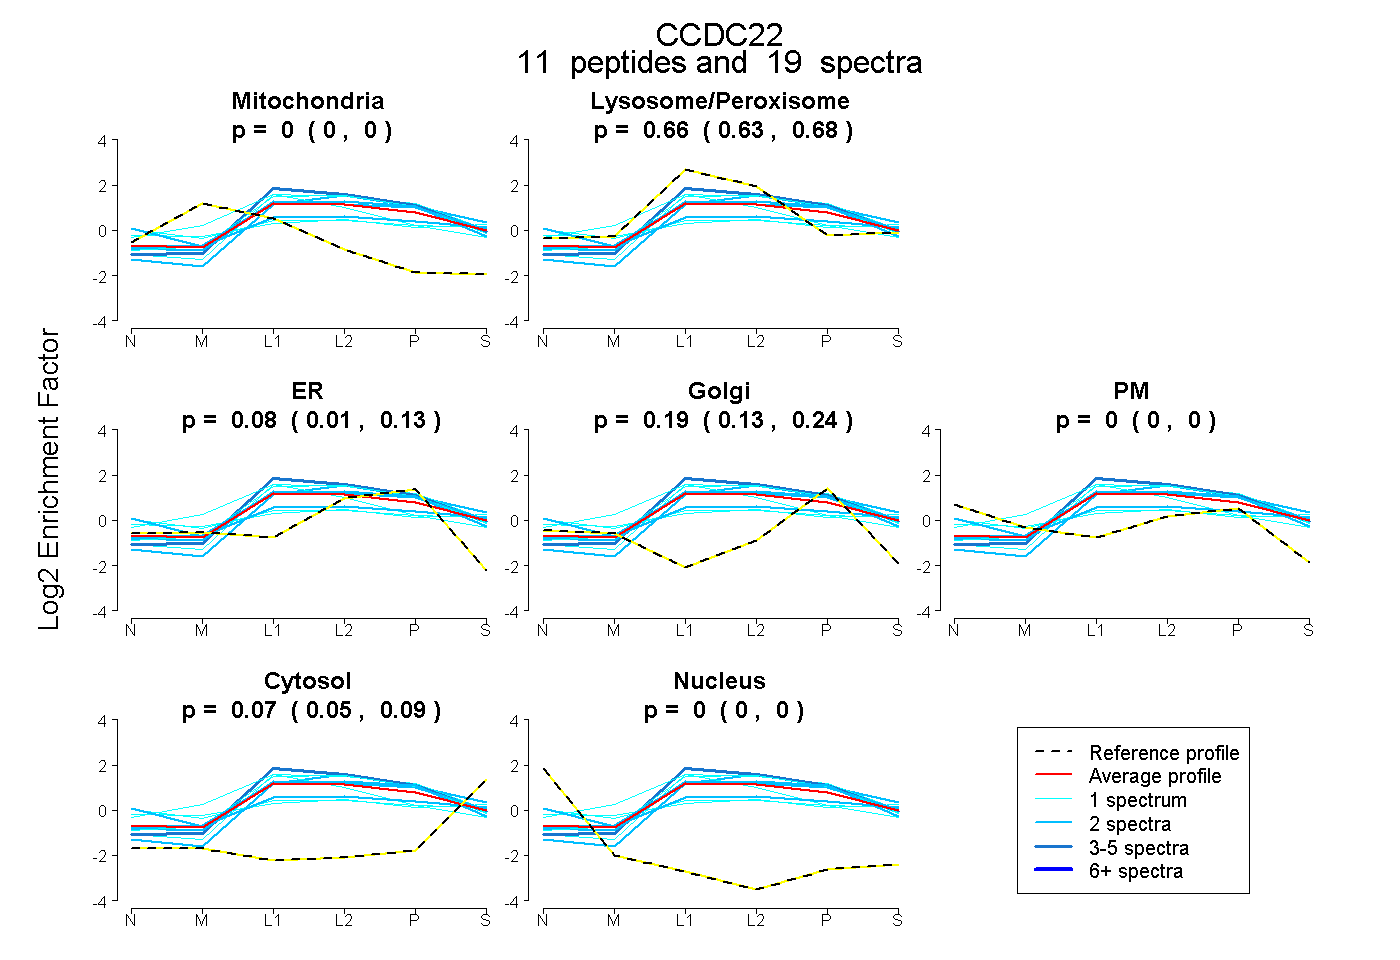 |
0.000 0.000 | 0.000 |
0.659 0.634 | 0.682 |
0.077 0.009 | 0.133 |
0.192 0.131 | 0.243 |
0.000 0.000 | 0.000 |
0.071 0.051 | 0.087 |
0.000 0.000 | 0.000 |
|||
| Plot | Lyso | Other | |||||||||||
| Expt C |
25 peptides |
85 spectra |
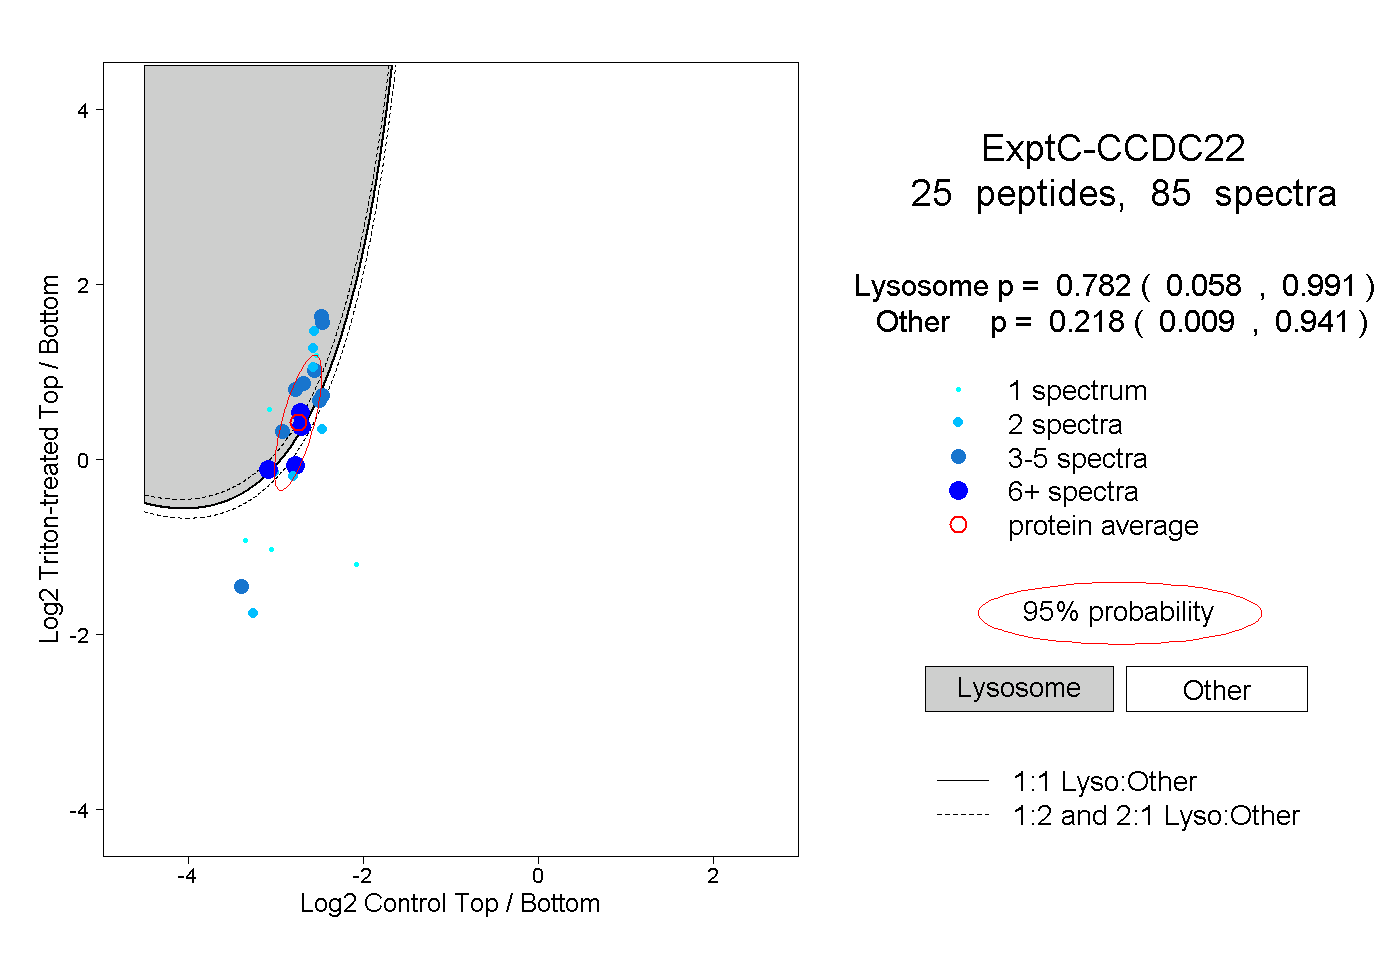 |
0.782 0.058 | 0.991 |
0.218 0.009 | 0.941 |
||||||||
| Plot | Lyso | Other | |||||||||||
| Expt D |
8 peptides |
16 spectra |
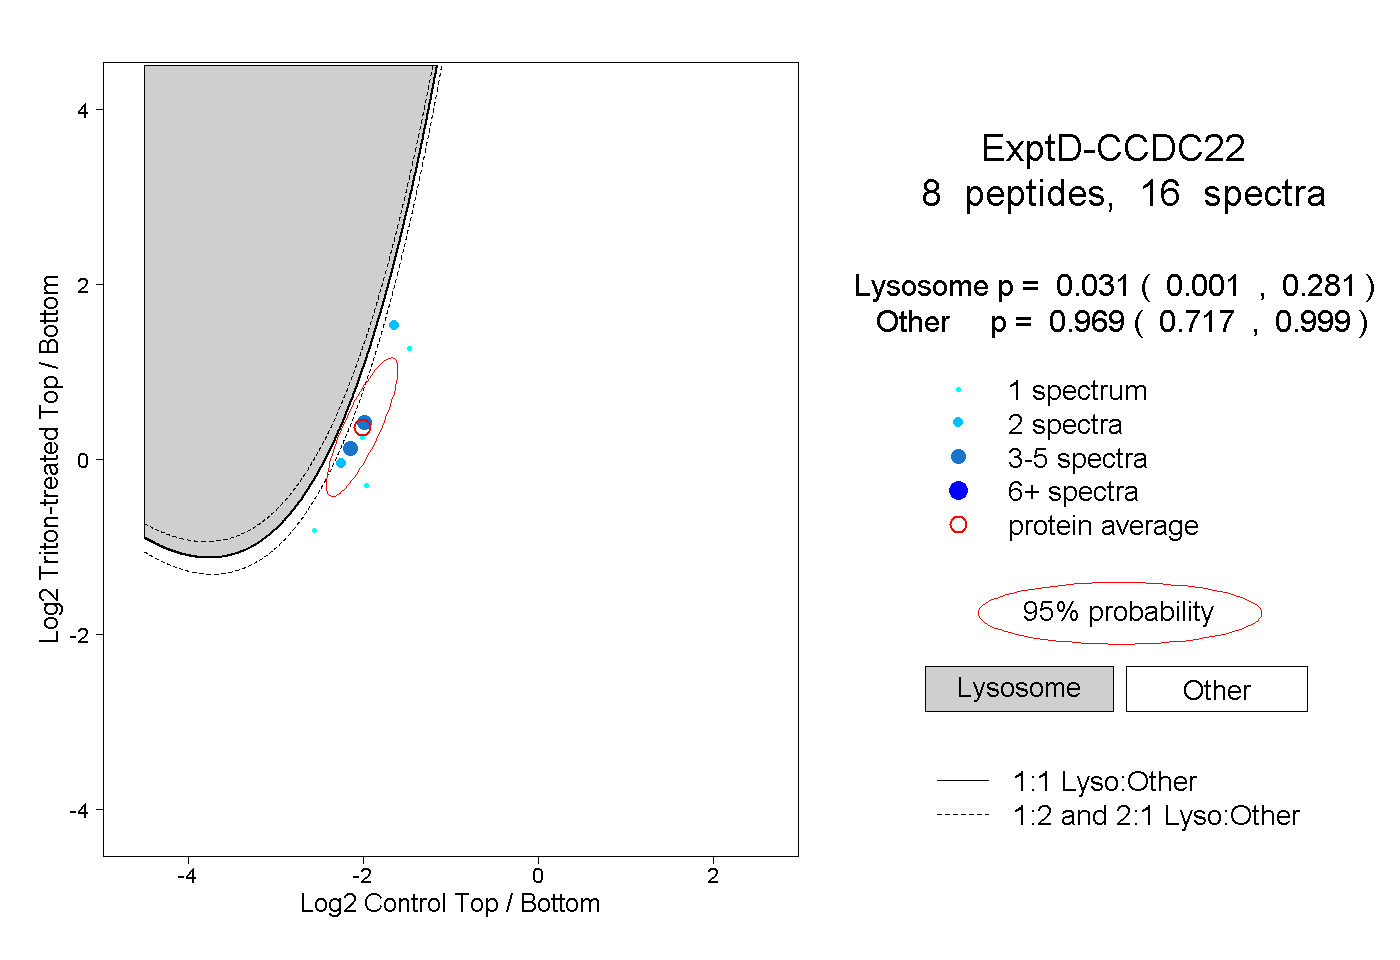 |
0.031 0.001 | 0.281 |
0.969 0.717 | 0.999 |