12
12peptides
spectra
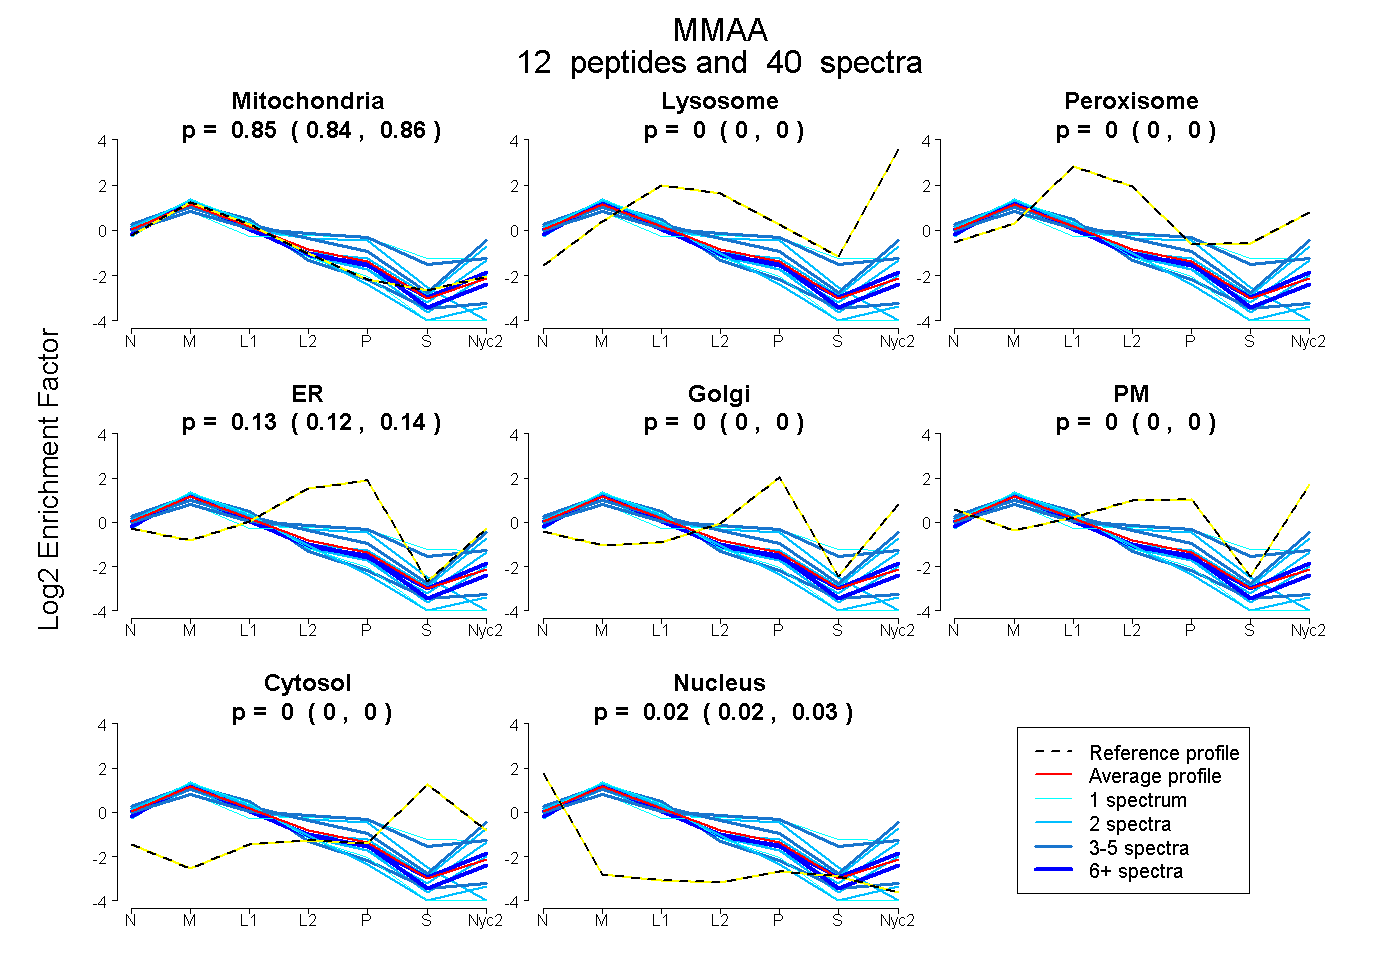
0.843 | 0.858
0.000 | 0.000
0.000 | 0.000
0.116 | 0.136
0.000 | 0.000
0.000 | 0.000
0.000 | 0.000
0.017 | 0.026
8peptides
spectra
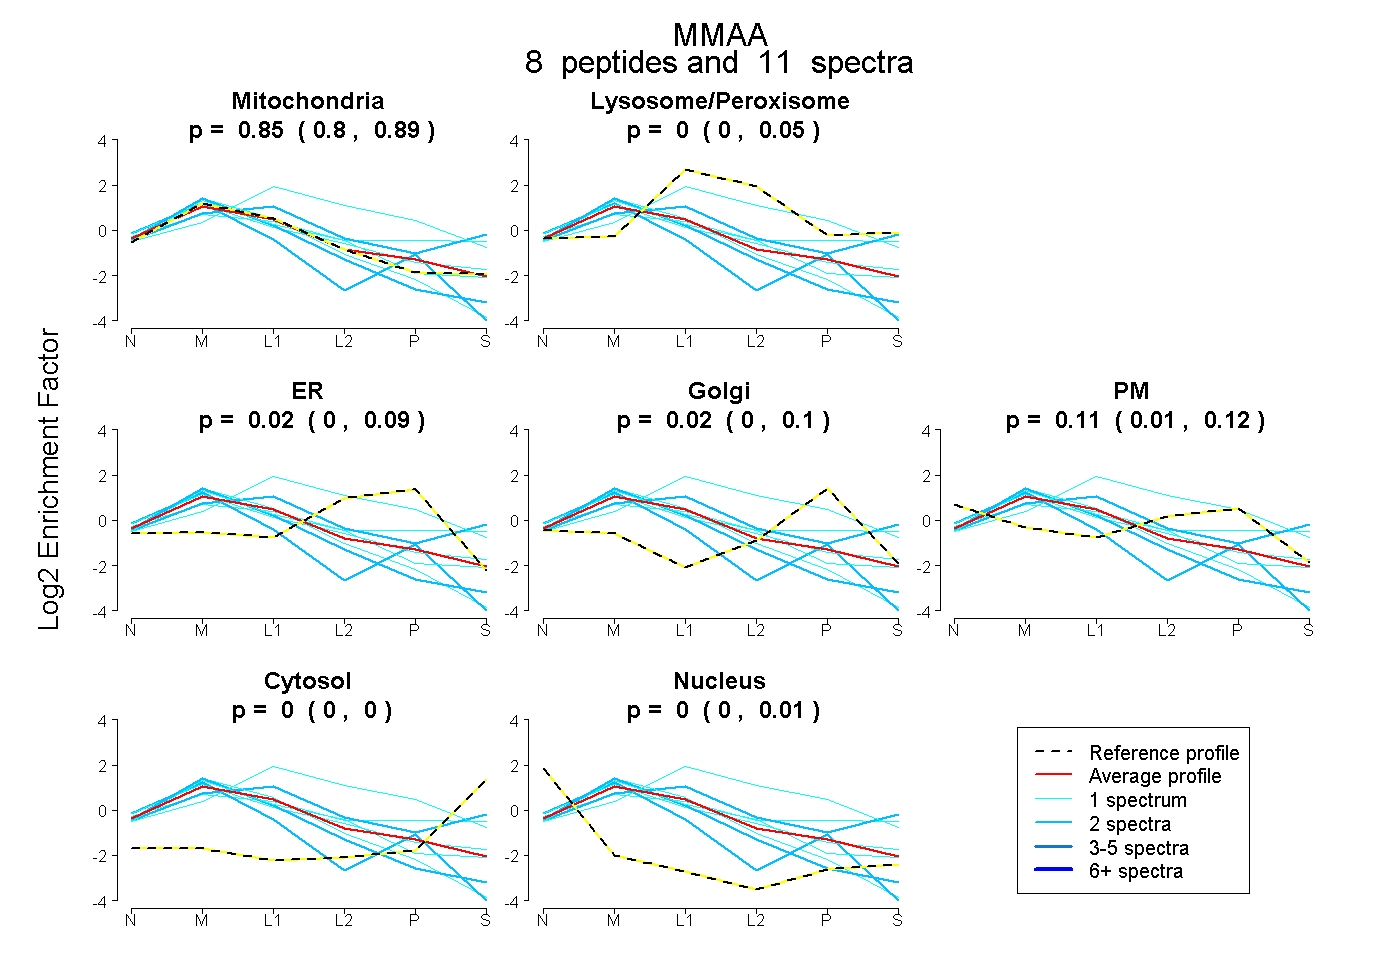
0.799 | 0.887
0.000 | 0.052
0.000 | 0.088
0.000 | 0.097
0.008 | 0.121
0.000 | 0.000
0.000 | 0.009