 17
17peptides
spectra
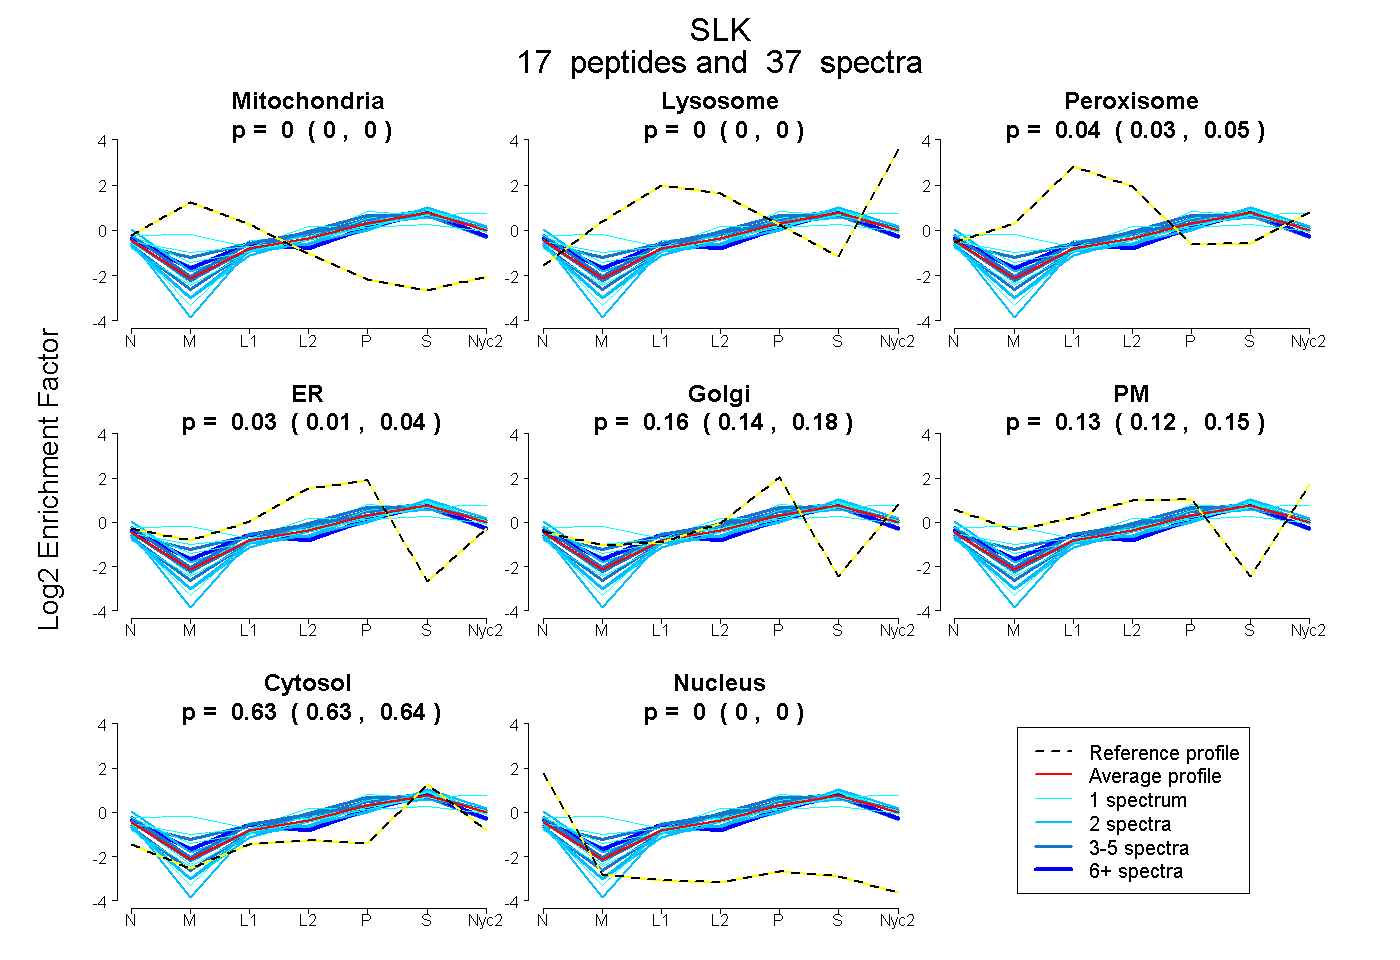
0.000 | 0.000
0.000 | 0.000
0.030 | 0.053
0.014 | 0.043
0.138 | 0.181
0.118 | 0.147
0.625 | 0.640
0.000 | 0.000
5peptides
spectra
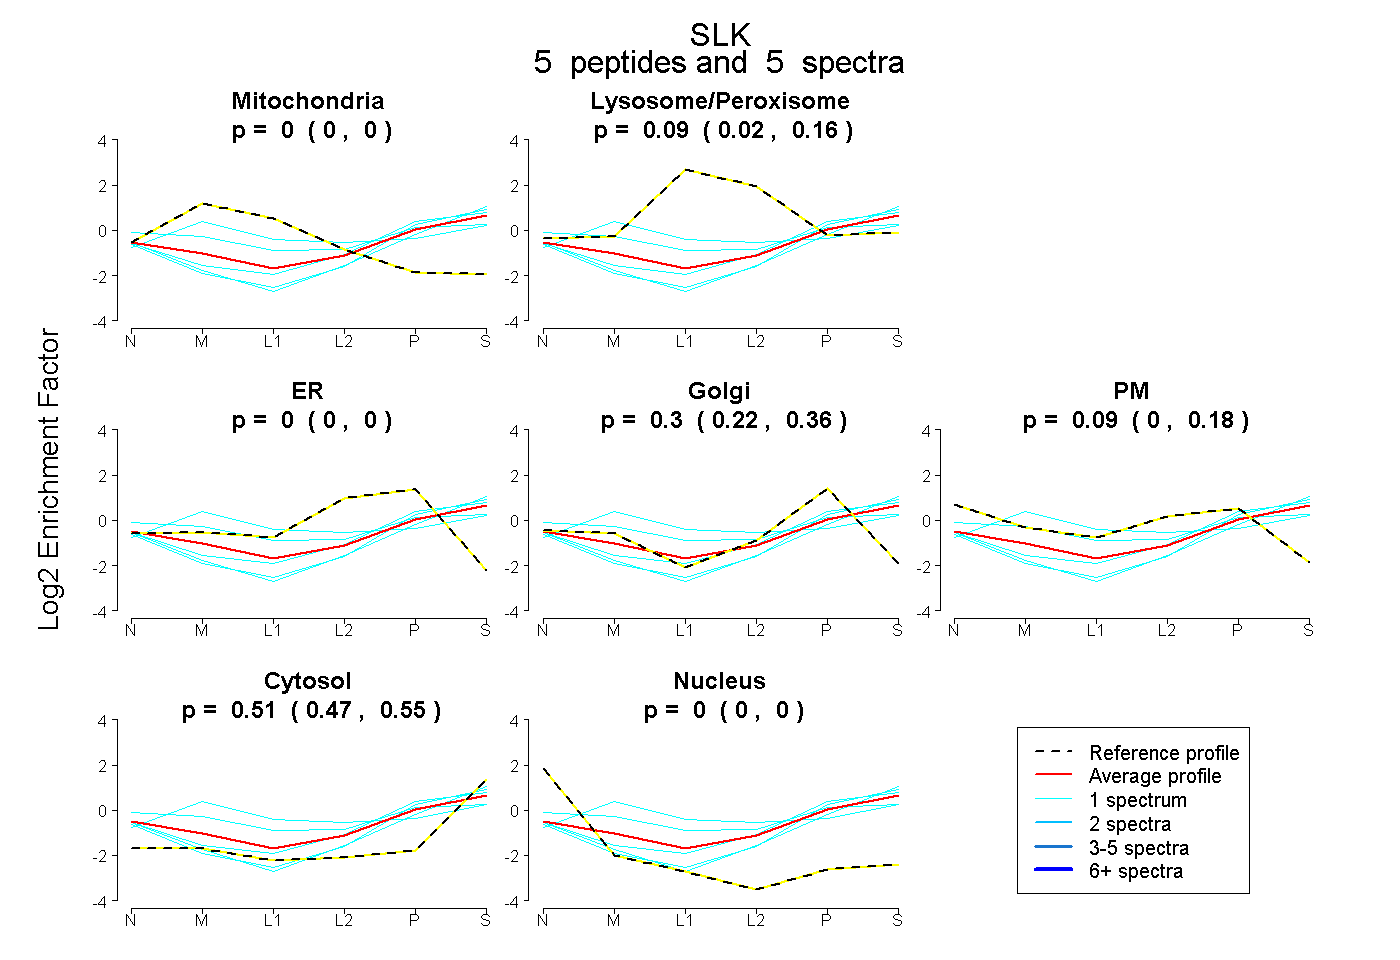
0.000 | 0.000
0.016 | 0.159
0.000 | 0.000
0.216 | 0.357
0.000 | 0.182
0.474 | 0.547
0.000 | 0.000
21peptides
spectra
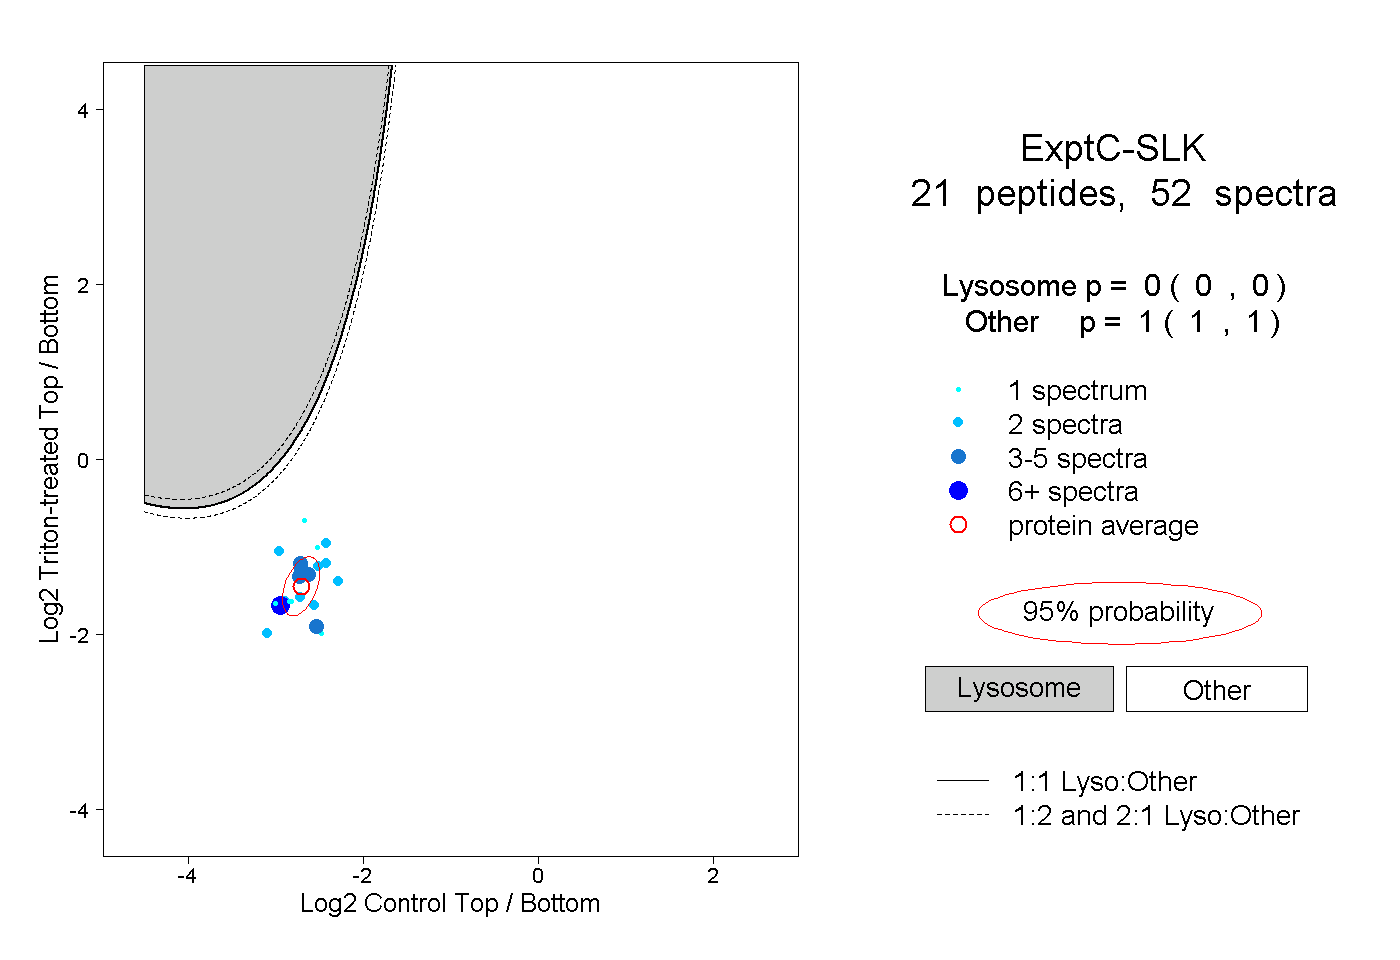
0.000 | 0.000
1.000 | 1.000
3peptides
spectra
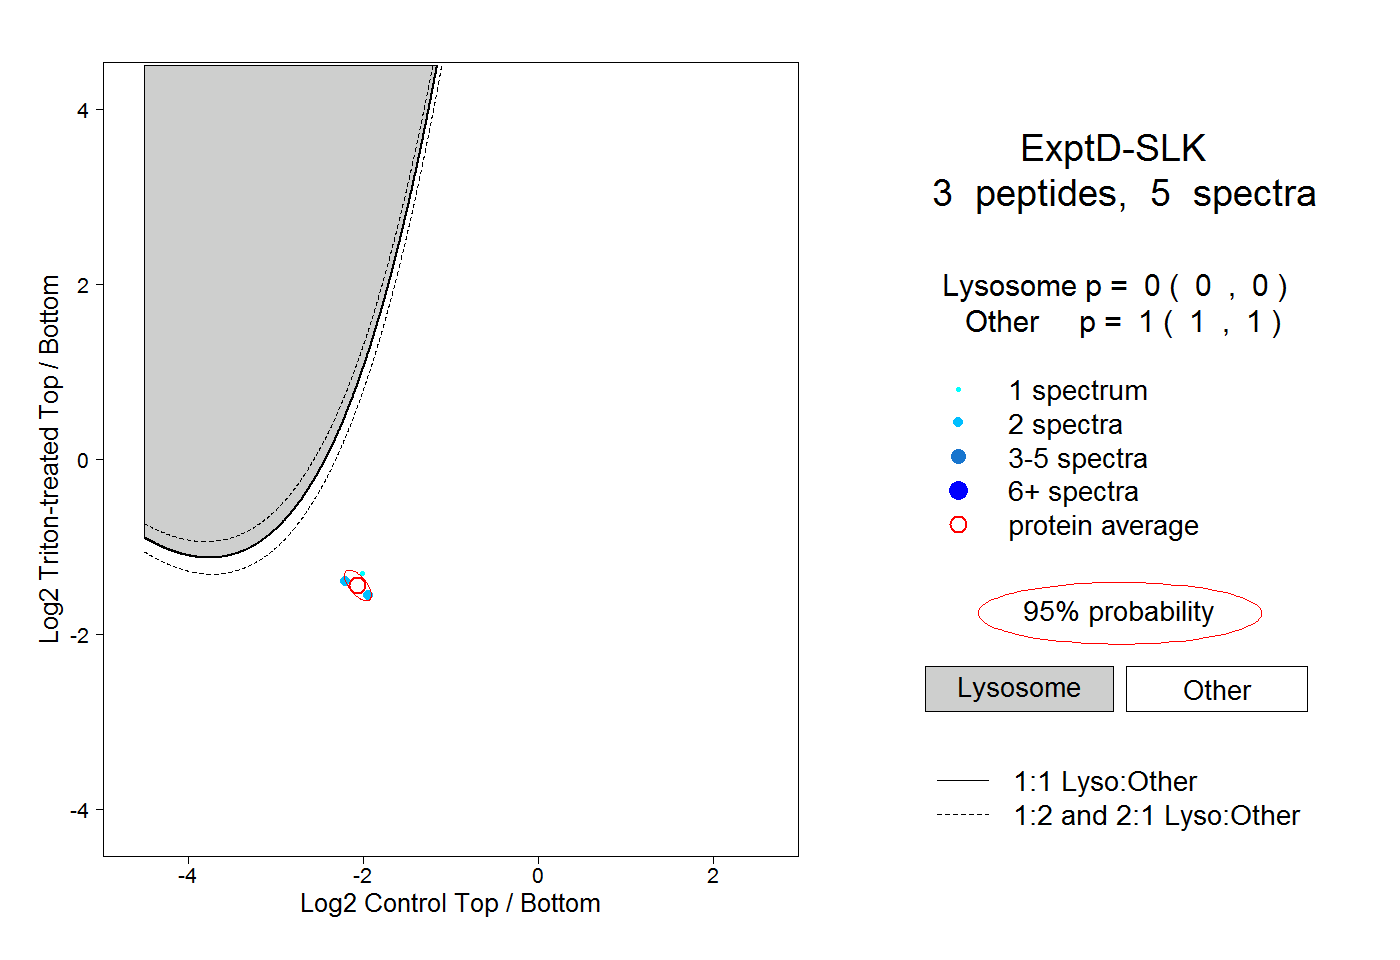
0.000 | 0.000
1.000 | 1.000