 6
6peptides
spectra
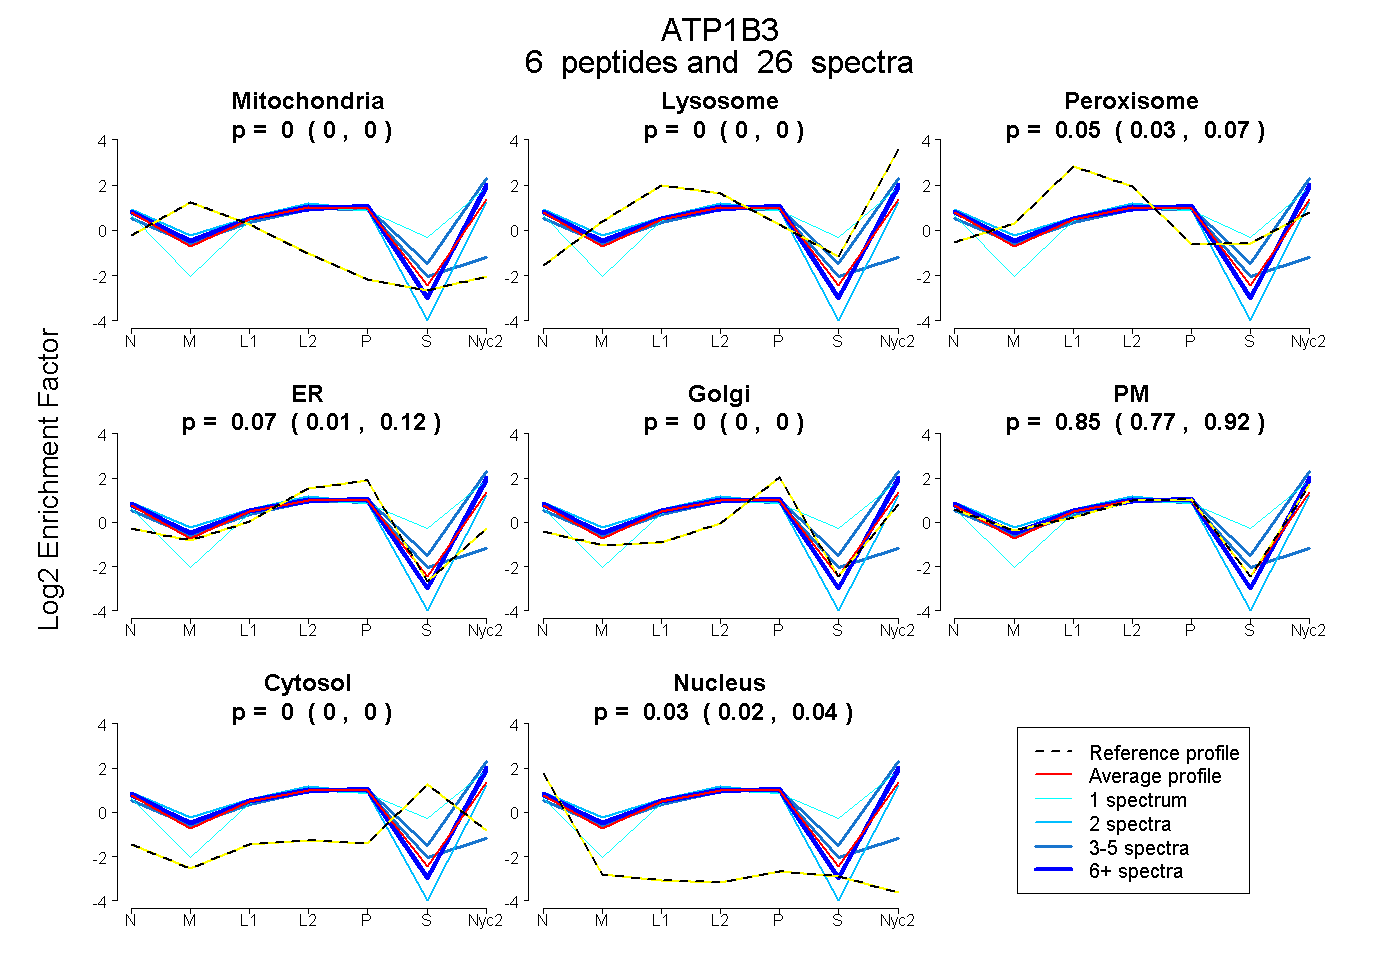
0.000 | 0.000
0.000 | 0.000
0.028 | 0.071
0.013 | 0.118
0.000 | 0.000
0.772 | 0.919
0.000 | 0.000
0.016 | 0.037
| Plot | Mito | Lyso | Perox | ER | Golgi | PM | Cytosol | Nucleus | |||||
| Expt A |
6 peptides |
26 spectra |
|
0.000 0.000 | 0.000 |
0.000 0.000 | 0.000 |
0.052 0.028 | 0.071 |
0.067 0.013 | 0.118 |
0.000 0.000 | 0.000 |
0.853 0.772 | 0.919 |
0.000 0.000 | 0.000 |
0.028 0.016 | 0.037 |
| 1 spectrum, QPLVAVQVIFGADATK | 0.000 | 0.153 | 0.003 | 0.000 | 0.000 | 0.586 | 0.257 | 0.000 | ||
| 2 spectra, GQPCVLVK | 0.058 | 0.000 | 0.000 | 0.110 | 0.000 | 0.832 | 0.000 | 0.000 | ||
| 5 spectra, EVTIECQIDGTR | 0.010 | 0.000 | 0.219 | 0.611 | 0.000 | 0.000 | 0.000 | 0.161 | ||
| 8 spectra, LFIYNPTSGEFLGR | 0.000 | 0.000 | 0.000 | 0.000 | 0.000 | 1.000 | 0.000 | 0.000 | ||
| 7 spectra, YFPYYGK | 0.000 | 0.000 | 0.000 | 0.000 | 0.000 | 1.000 | 0.000 | 0.000 | ||
| 3 spectra, FVEDLK | 0.000 | 0.174 | 0.000 | 0.000 | 0.000 | 0.765 | 0.061 | 0.000 |
| Plot | Mito | Lyso or Perox | ER | Golgi | PM | Cytosol | Nucleus | ||||||
| Expt B |
4 peptides |
6 spectra |
 |
0.176 0.109 | 0.226 |
0.000 0.000 | 0.031 |
0.000 0.000 | 0.009 |
0.000 0.000 | 0.000 |
0.820 0.745 | 0.863 |
0.000 0.000 | 0.000 |
0.004 0.000 | 0.040 |
|||
| Plot | Lyso | Other | |||||||||||
| Expt C |
6 peptides |
52 spectra |
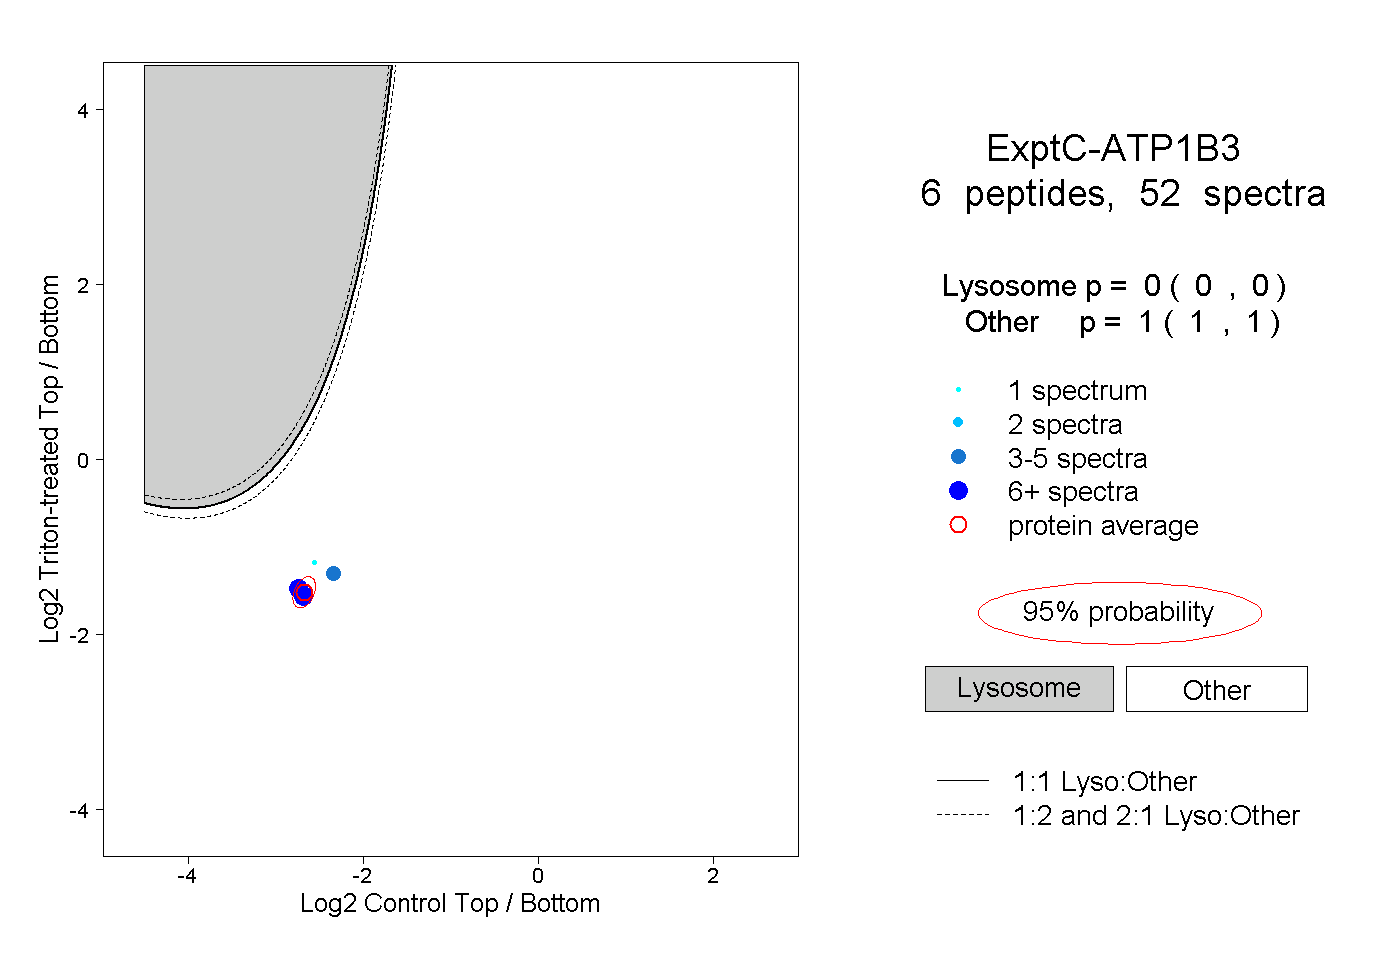 |
0.000 0.000 | 0.000 |
1.000 1.000 | 1.000 |
||||||||
| Plot | Lyso | Other | |||||||||||
| Expt D |
3 peptides |
4 spectra |
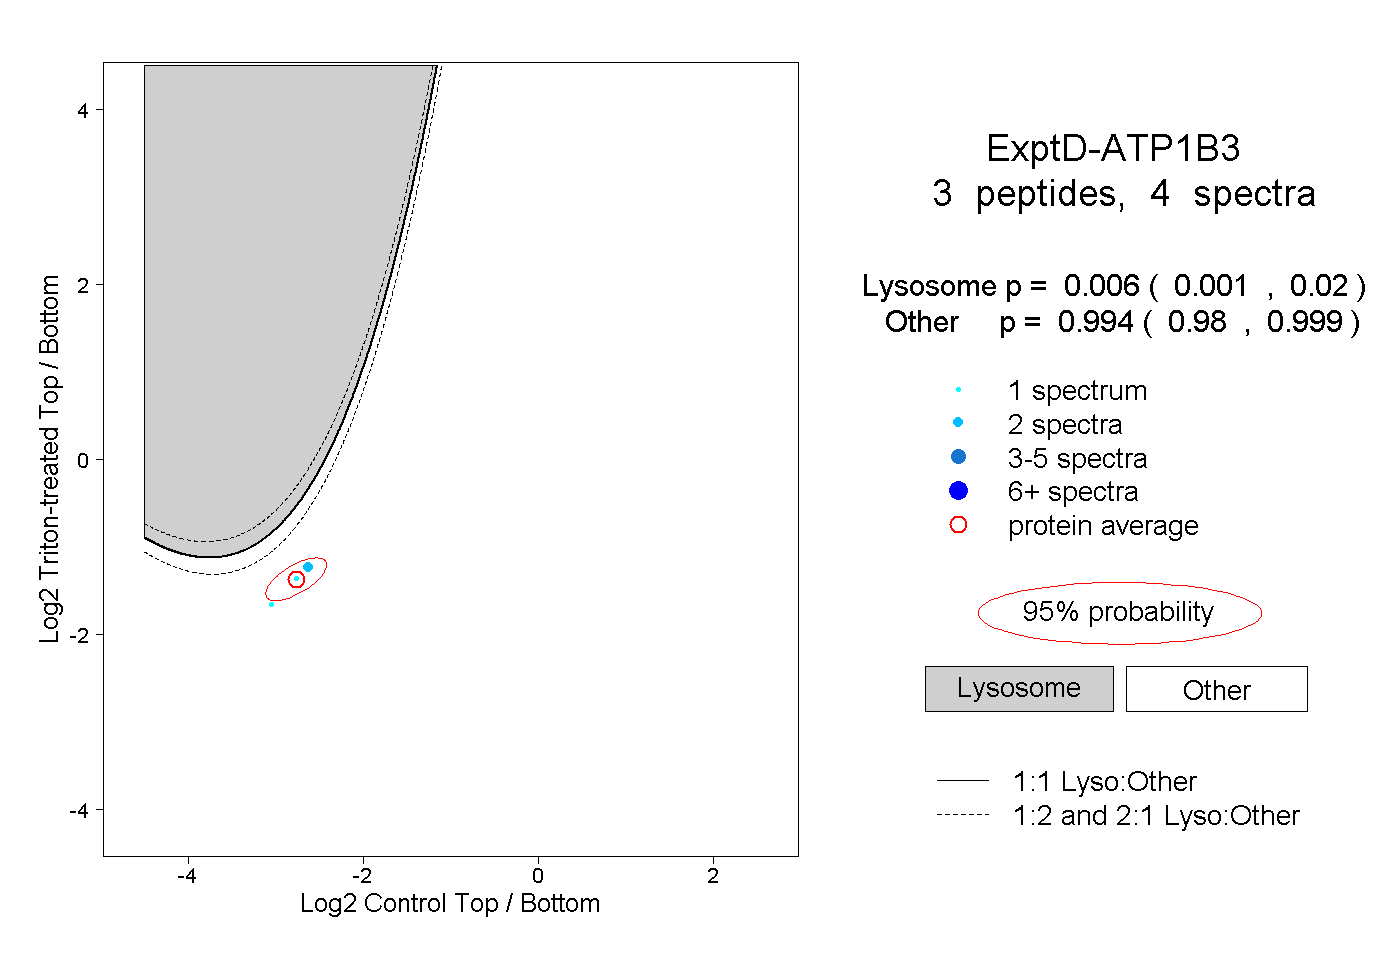 |
0.006 0.001 | 0.020 |
0.994 0.980 | 0.999 |