 6
6peptides
spectra
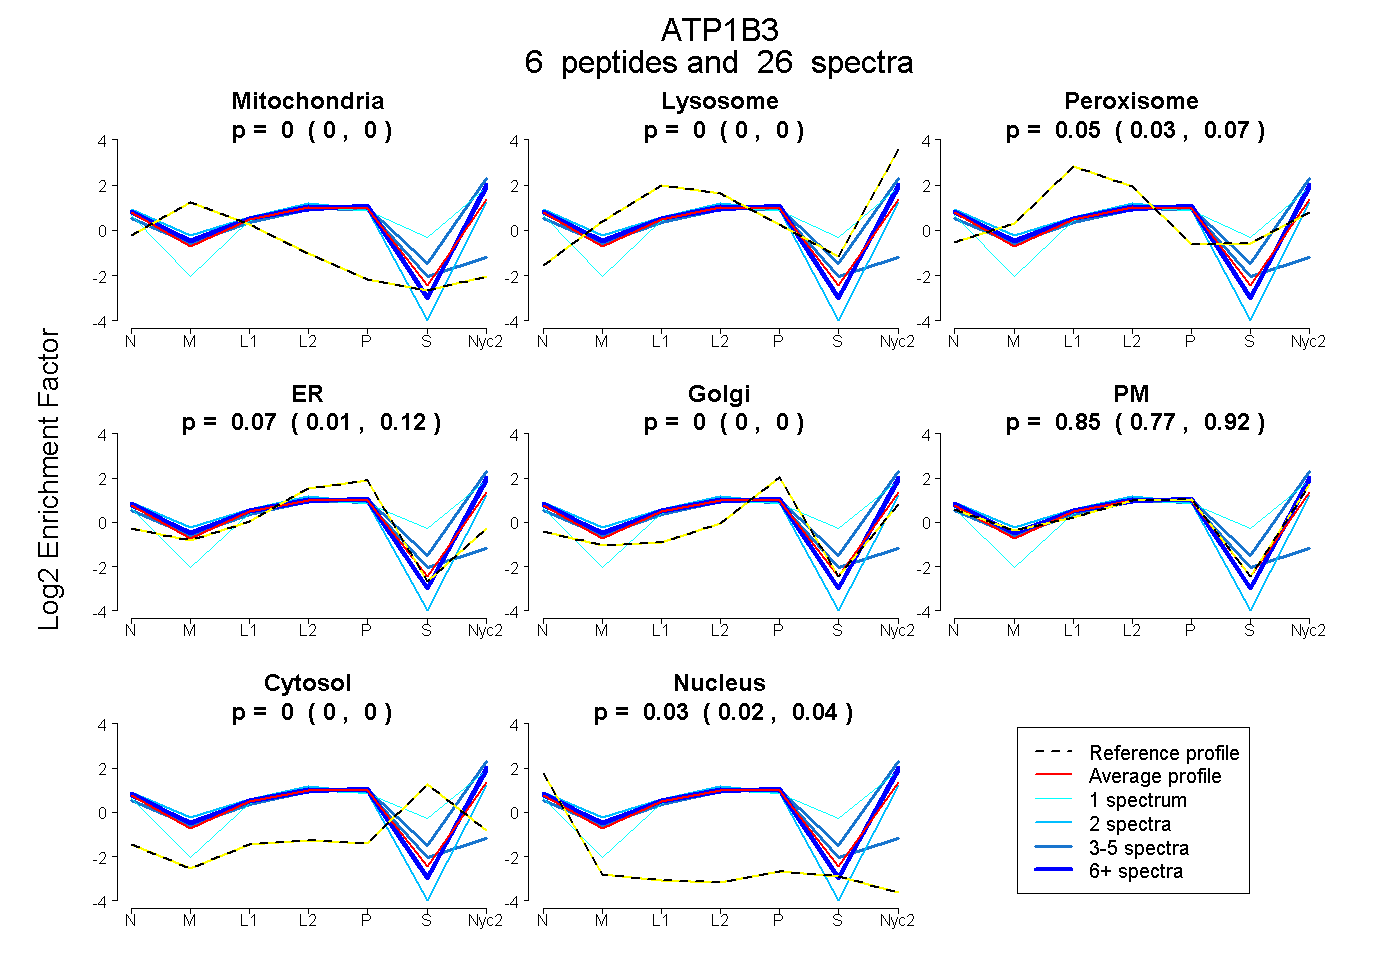
0.000 | 0.000
0.000 | 0.000
0.028 | 0.071
0.013 | 0.118
0.000 | 0.000
0.772 | 0.919
0.000 | 0.000
0.016 | 0.037
4peptides
spectra
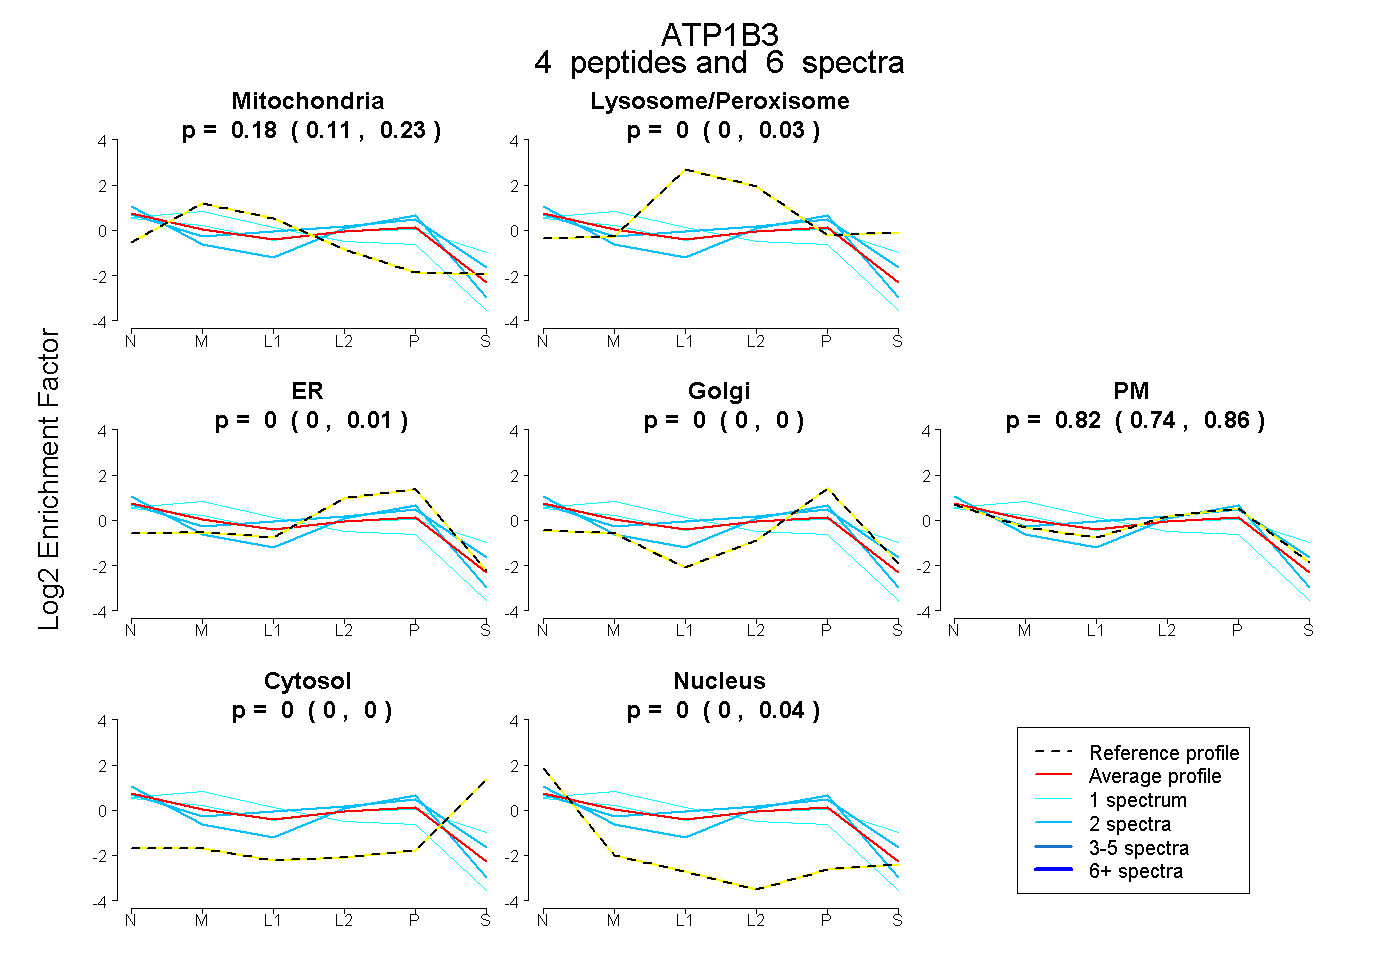
0.109 | 0.226
0.000 | 0.031
0.000 | 0.009
0.000 | 0.000
0.745 | 0.863
0.000 | 0.000
0.000 | 0.040
6peptides
spectra
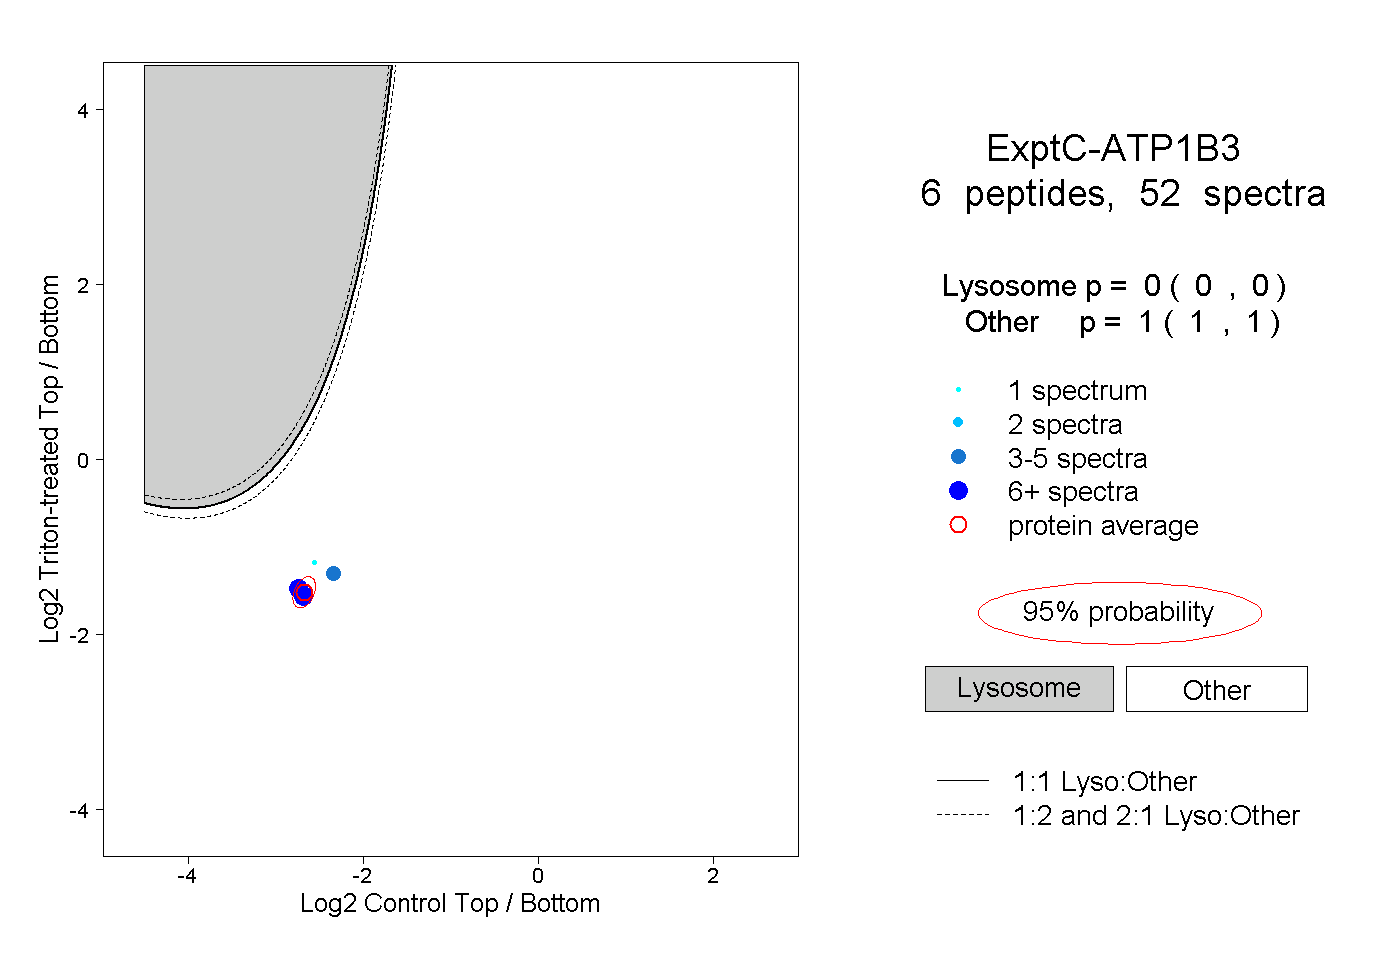
0.000 | 0.000
1.000 | 1.000
3peptides
spectra
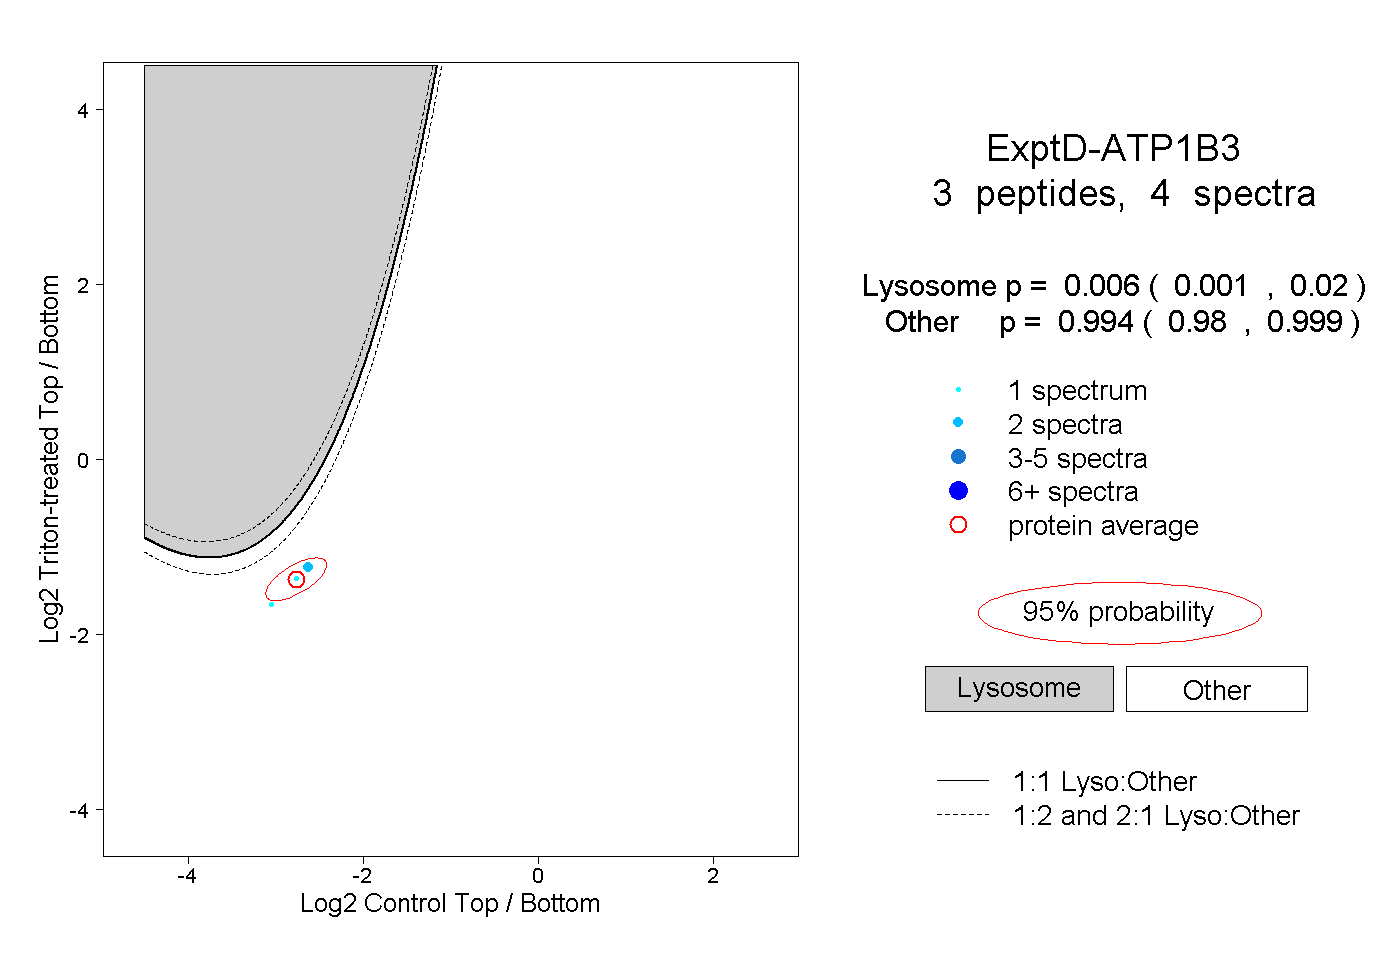
0.001 | 0.020
0.980 | 0.999