 4
4peptides
spectra
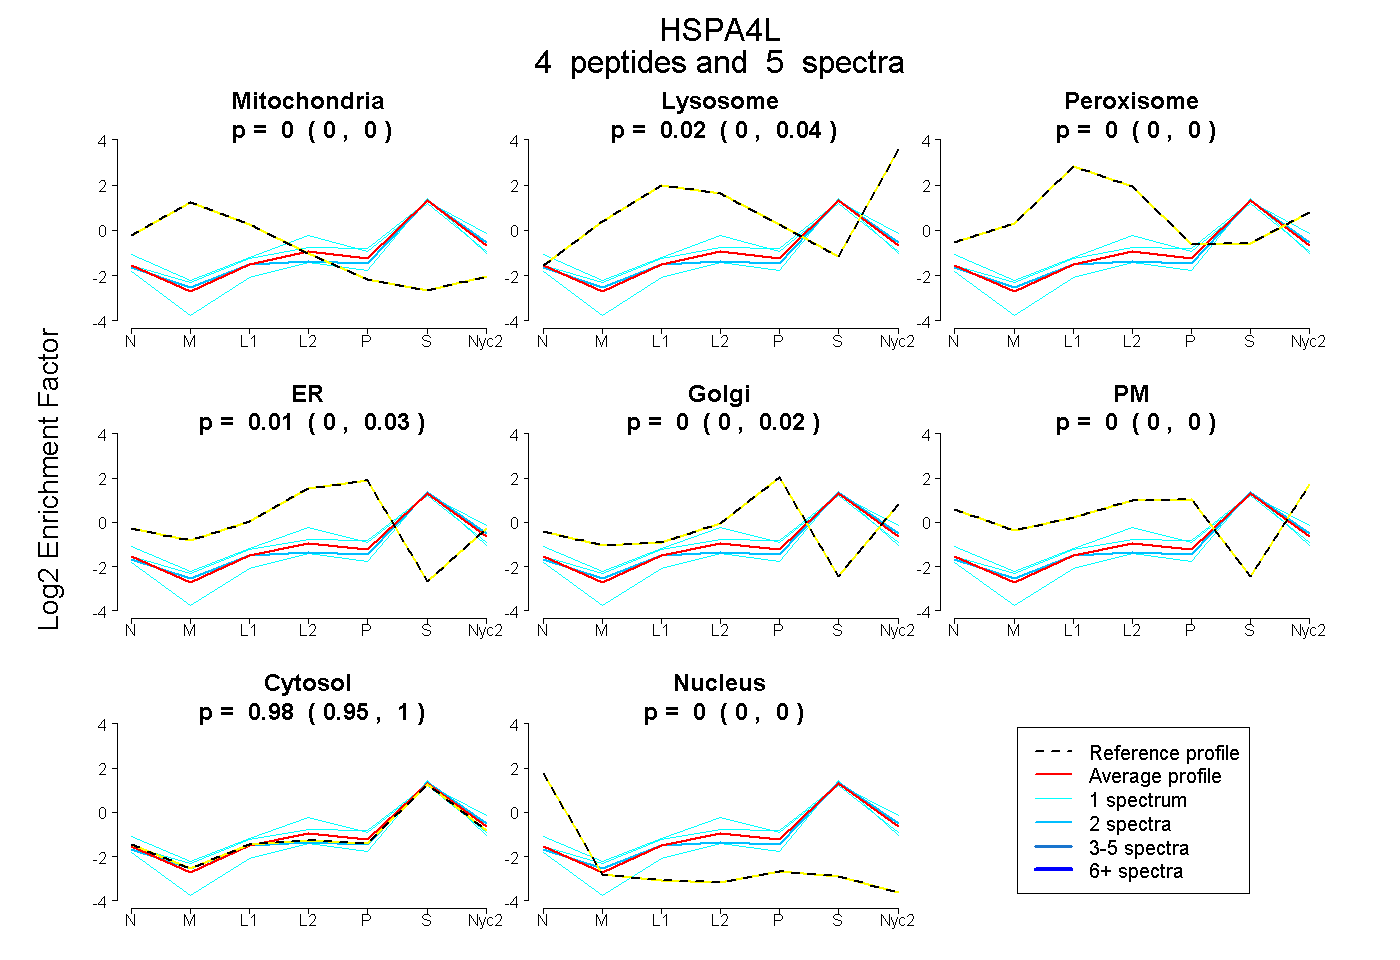
0.000 | 0.000
0.000 | 0.040
0.000 | 0.000
0.000 | 0.030
0.000 | 0.020
0.000 | 0.000
0.945 | 0.998
0.000 | 0.000
1peptide
spectrum
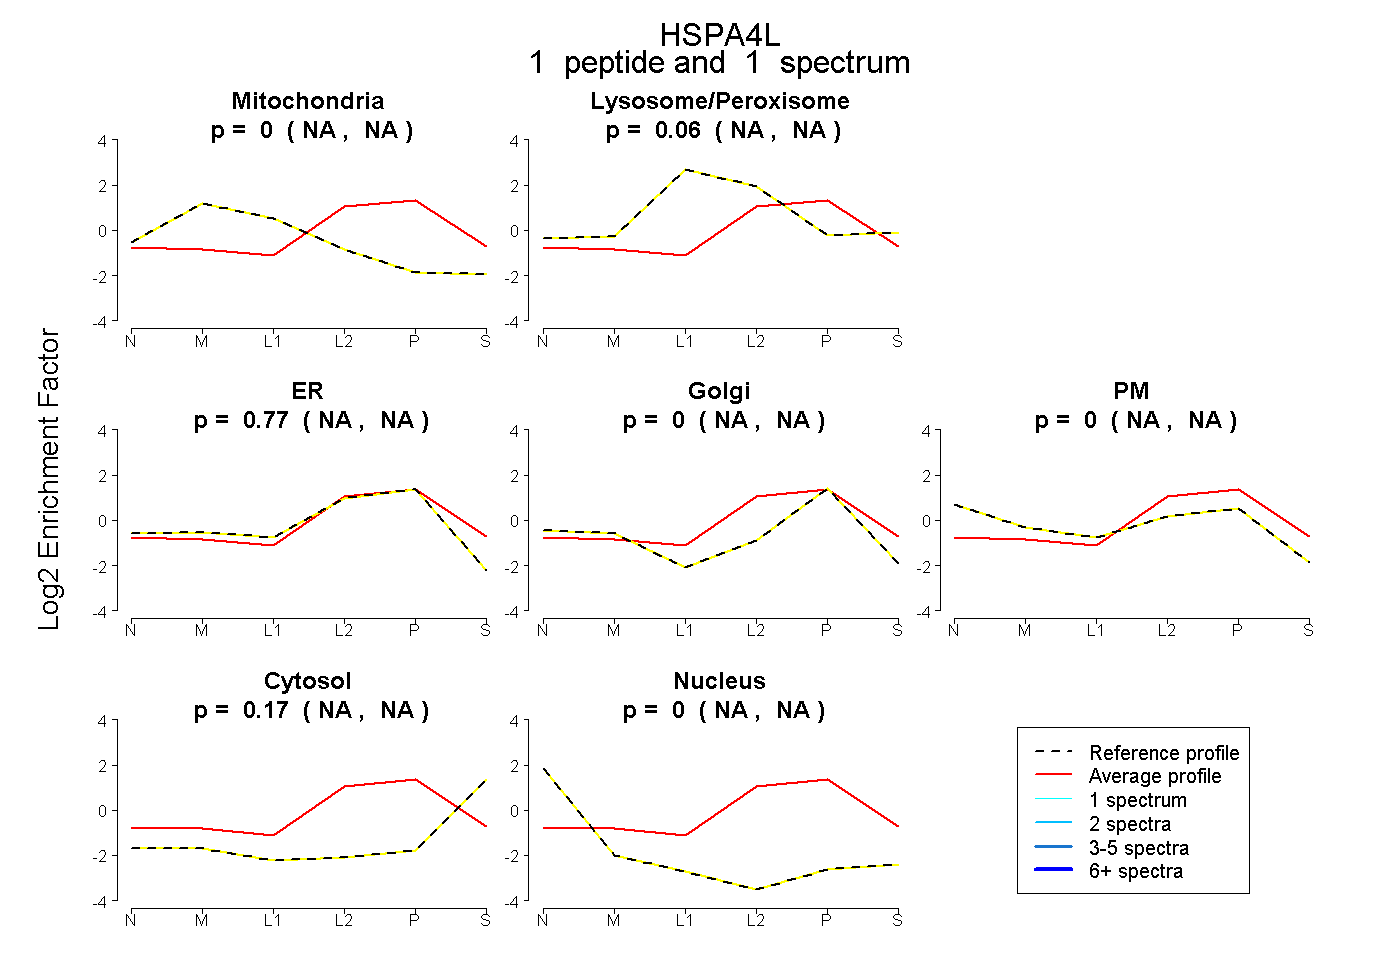
NA | NA
NA | NA
NA | NA
NA | NA
NA | NA
NA | NA
NA | NA
2peptides
spectra
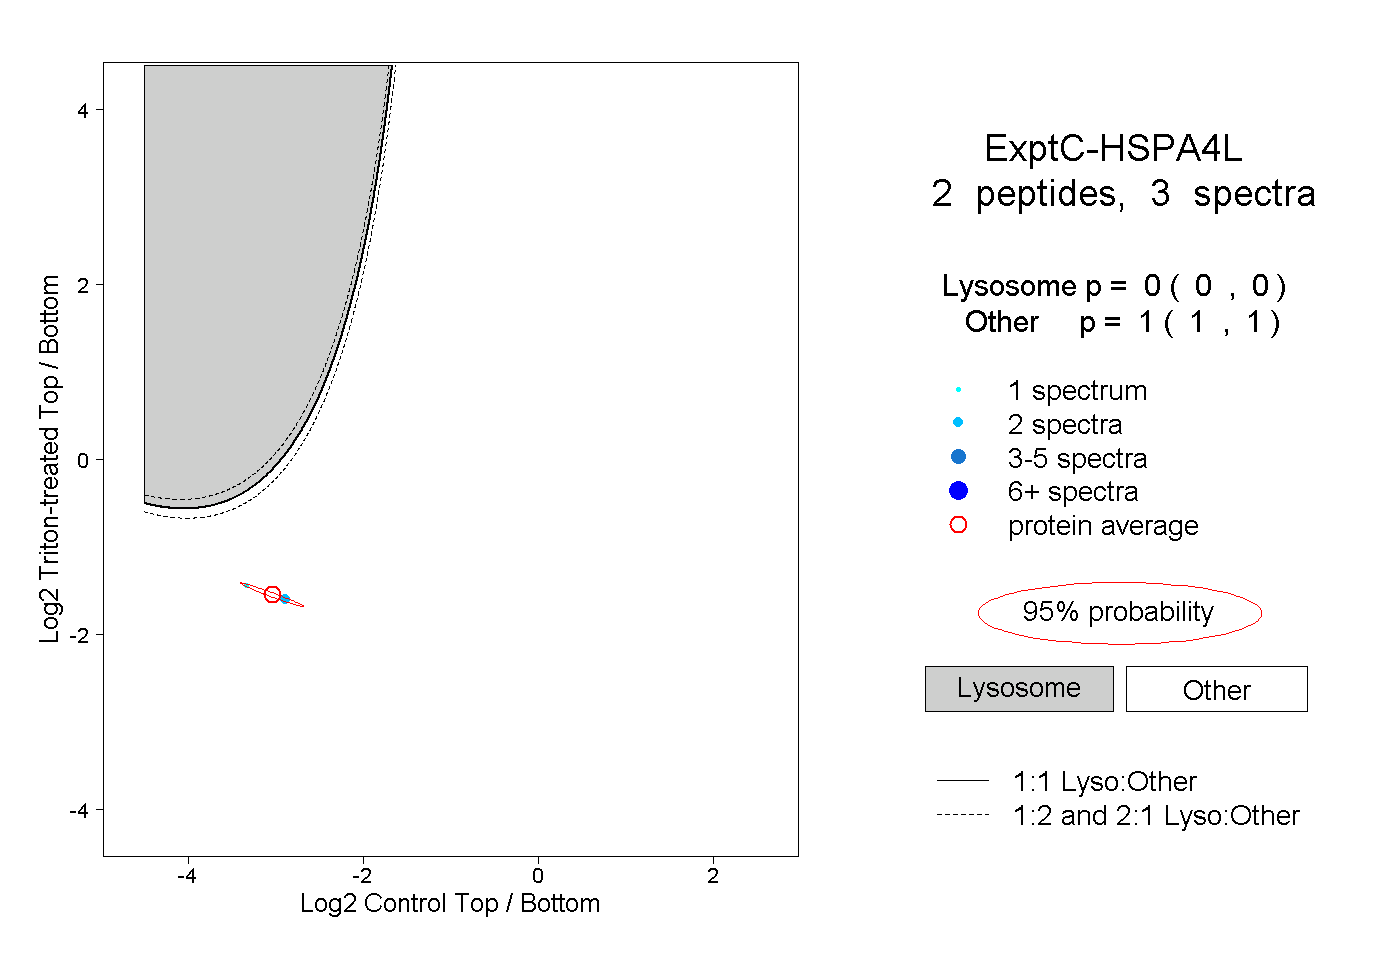
0.000 | 0.000
1.000 | 1.000