 2
2peptides
spectra
0.000 | 0.000
0.309 | 0.398
0.000 | 0.000
0.000 | 0.000
0.000 | 0.091
0.150 | 0.311
0.333 | 0.392
0.000 | 0.000
5peptides
spectra
0.000 | 0.007
0.993 | 1.000
| Plot | Mito | Lyso | Perox | ER | Golgi | PM | Cytosol | Nucleus | |||||
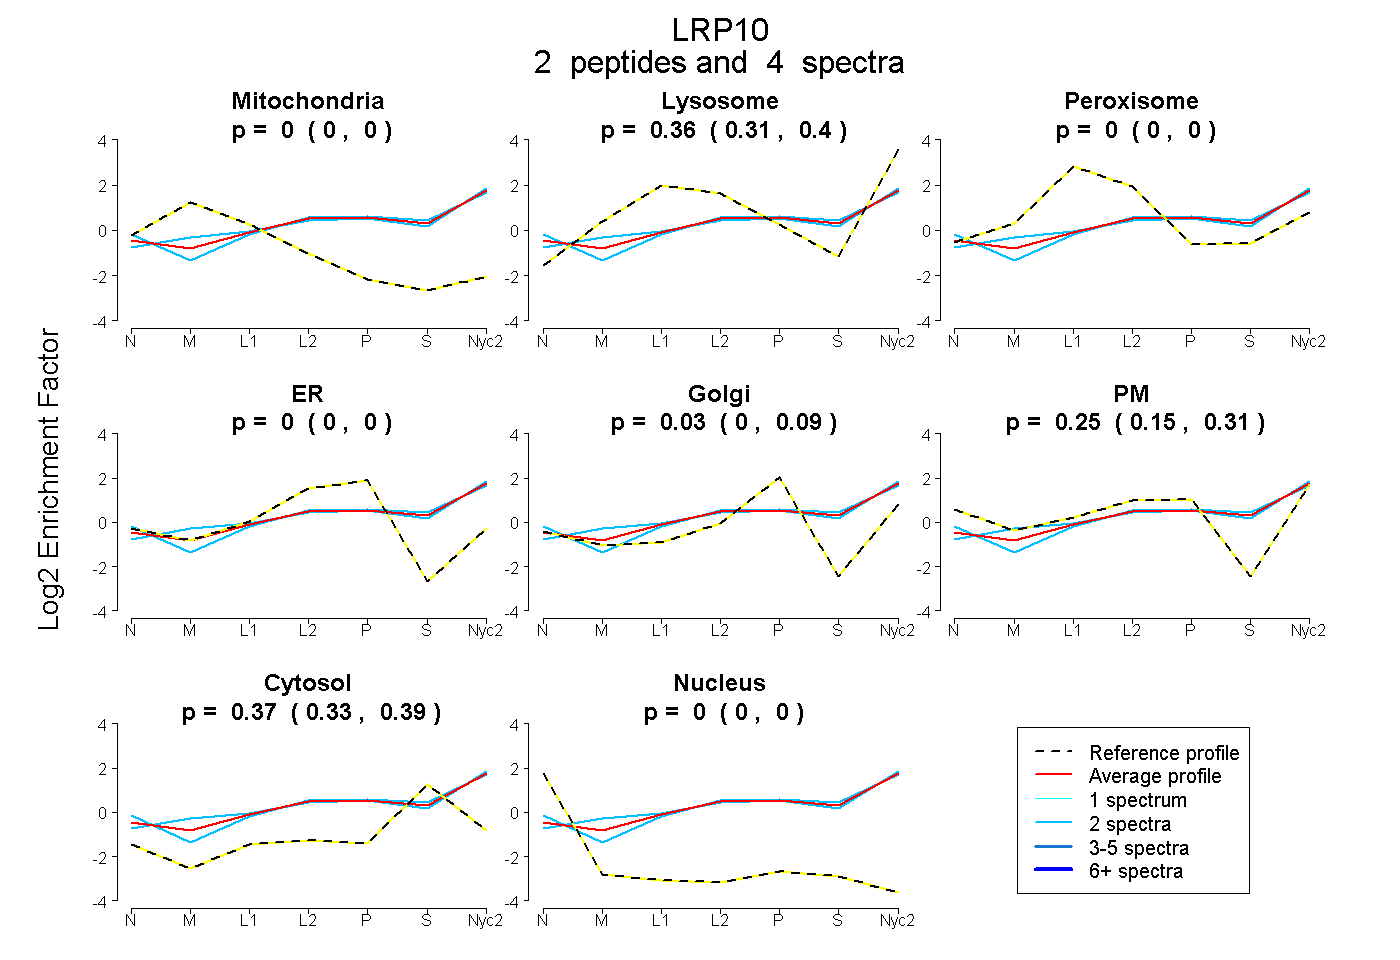
| Expt A |
2 peptides |
4 spectra |
|
0.000 0.000 | 0.000 |
0.355 0.309 | 0.398 |
0.000 0.000 | 0.000 |
0.000 0.000 | 0.000 |
0.027 0.000 | 0.091 |
0.252 0.150 | 0.311 |
0.366 0.333 | 0.392 |
0.000 0.000 | 0.000 |
||
| Plot | Lyso | Other | |||||||||||
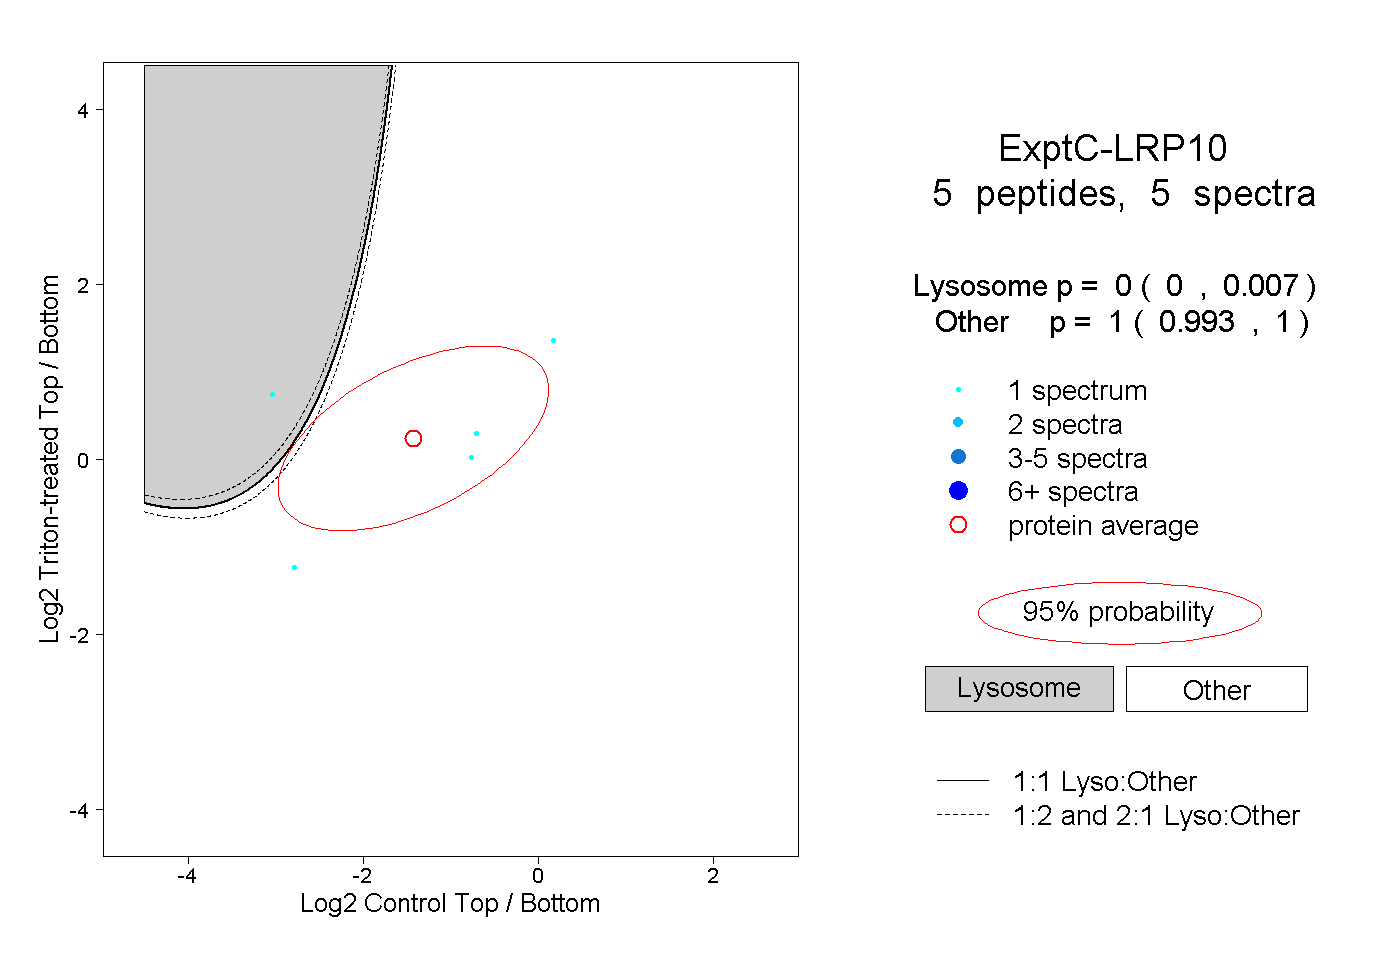
| Expt C |
5 peptides |
5 spectra |
|
0.000 0.000 | 0.007 |
1.000 0.993 | 1.000 |