 5
5peptides
spectra
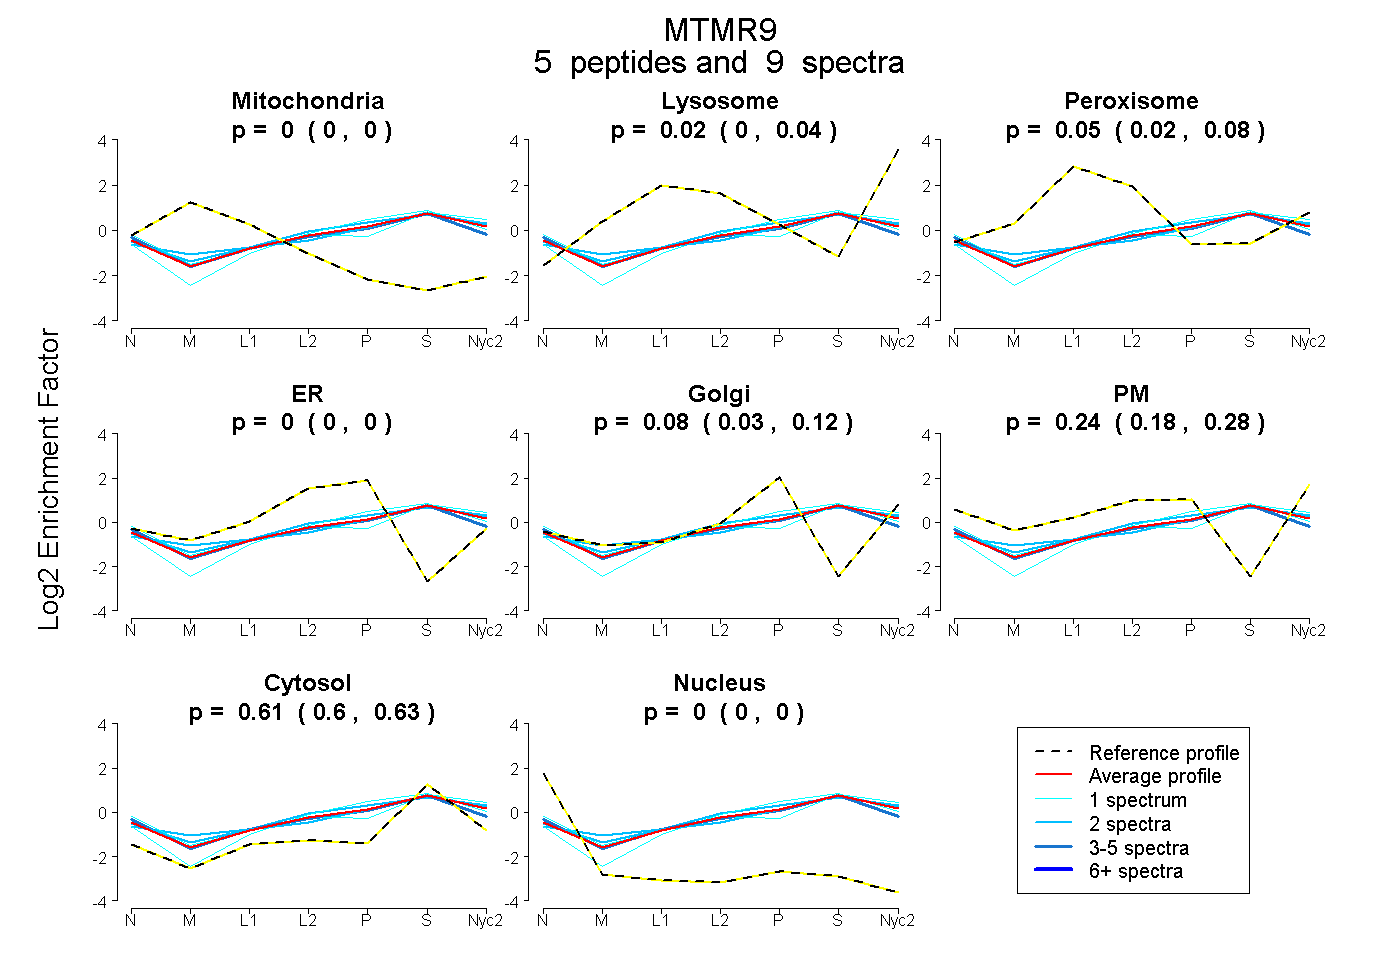
0.000 | 0.000
0.000 | 0.044
0.023 | 0.075
0.000 | 0.000
0.031 | 0.118
0.182 | 0.279
0.595 | 0.626
0.000 | 0.000
| Plot | Mito | Lyso | Perox | ER | Golgi | PM | Cytosol | Nucleus | |||||
| Expt A |
5 peptides |
9 spectra |
|
0.000 0.000 | 0.000 |
0.022 0.000 | 0.044 |
0.051 0.023 | 0.075 |
0.000 0.000 | 0.000 |
0.078 0.031 | 0.118 |
0.236 0.182 | 0.279 |
0.612 0.595 | 0.626 |
0.000 0.000 | 0.000 |
| 2 spectra, LINATLR | 0.000 | 0.095 | 0.092 | 0.000 | 0.206 | 0.078 | 0.528 | 0.000 | ||
| 3 spectra, LVEACNEQTHSMDR | 0.000 | 0.000 | 0.044 | 0.090 | 0.000 | 0.225 | 0.641 | 0.000 | ||
| 1 spectrum, SLNVAQQAR | 0.000 | 0.052 | 0.024 | 0.000 | 0.000 | 0.301 | 0.623 | 0.000 | ||
| 2 spectra, SIDDEALR | 0.000 | 0.062 | 0.040 | 0.000 | 0.097 | 0.190 | 0.610 | 0.000 | ||
| 1 spectrum, SGQPLTGTNGR | 0.000 | 0.038 | 0.000 | 0.115 | 0.167 | 0.034 | 0.646 | 0.000 |
| Plot | Lyso | Other | |||||||||||
| Expt C |
5 peptides |
9 spectra |
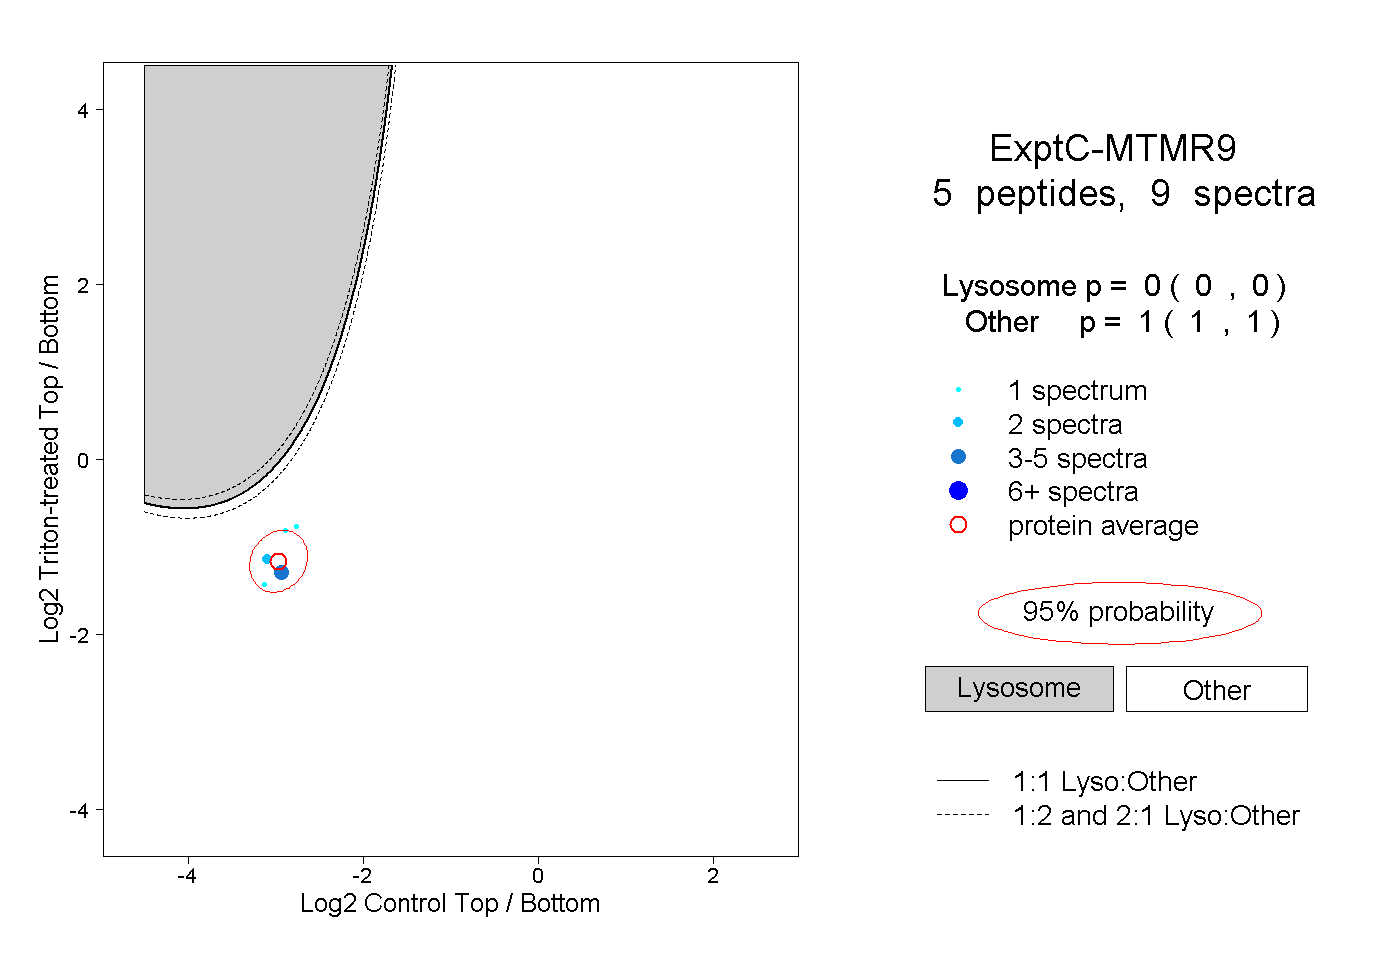 |
0.000 0.000 | 0.000 |
1.000 1.000 | 1.000 |
||||||||
| Plot | Lyso | Other | |||||||||||
| Expt D |
1 peptide |
1 spectrum |
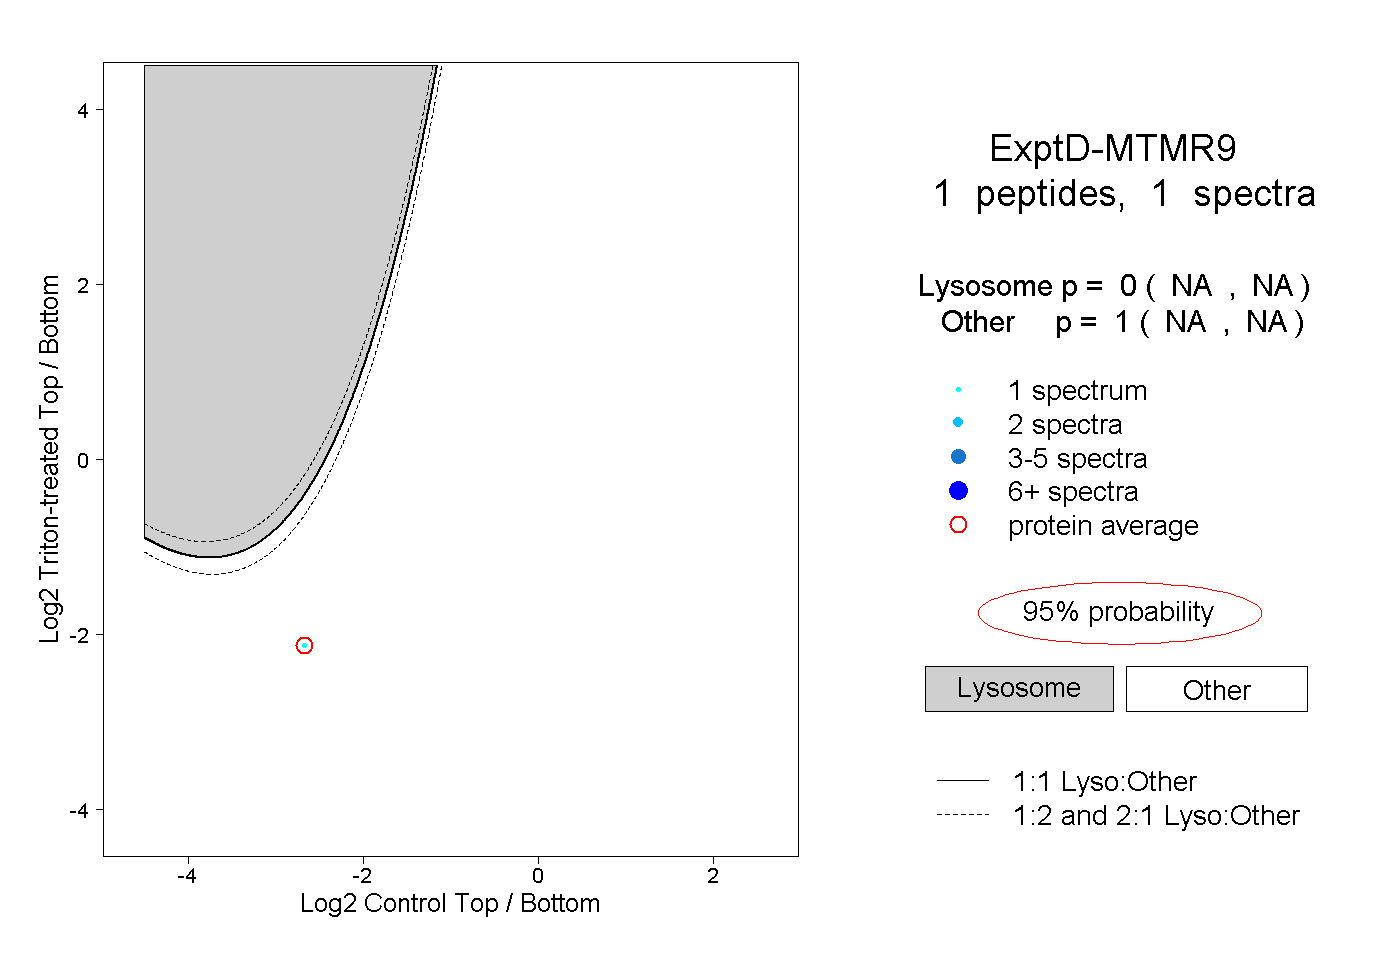 |
0.000 NA | NA |
1.000 NA | NA |