 9
9peptides
spectra
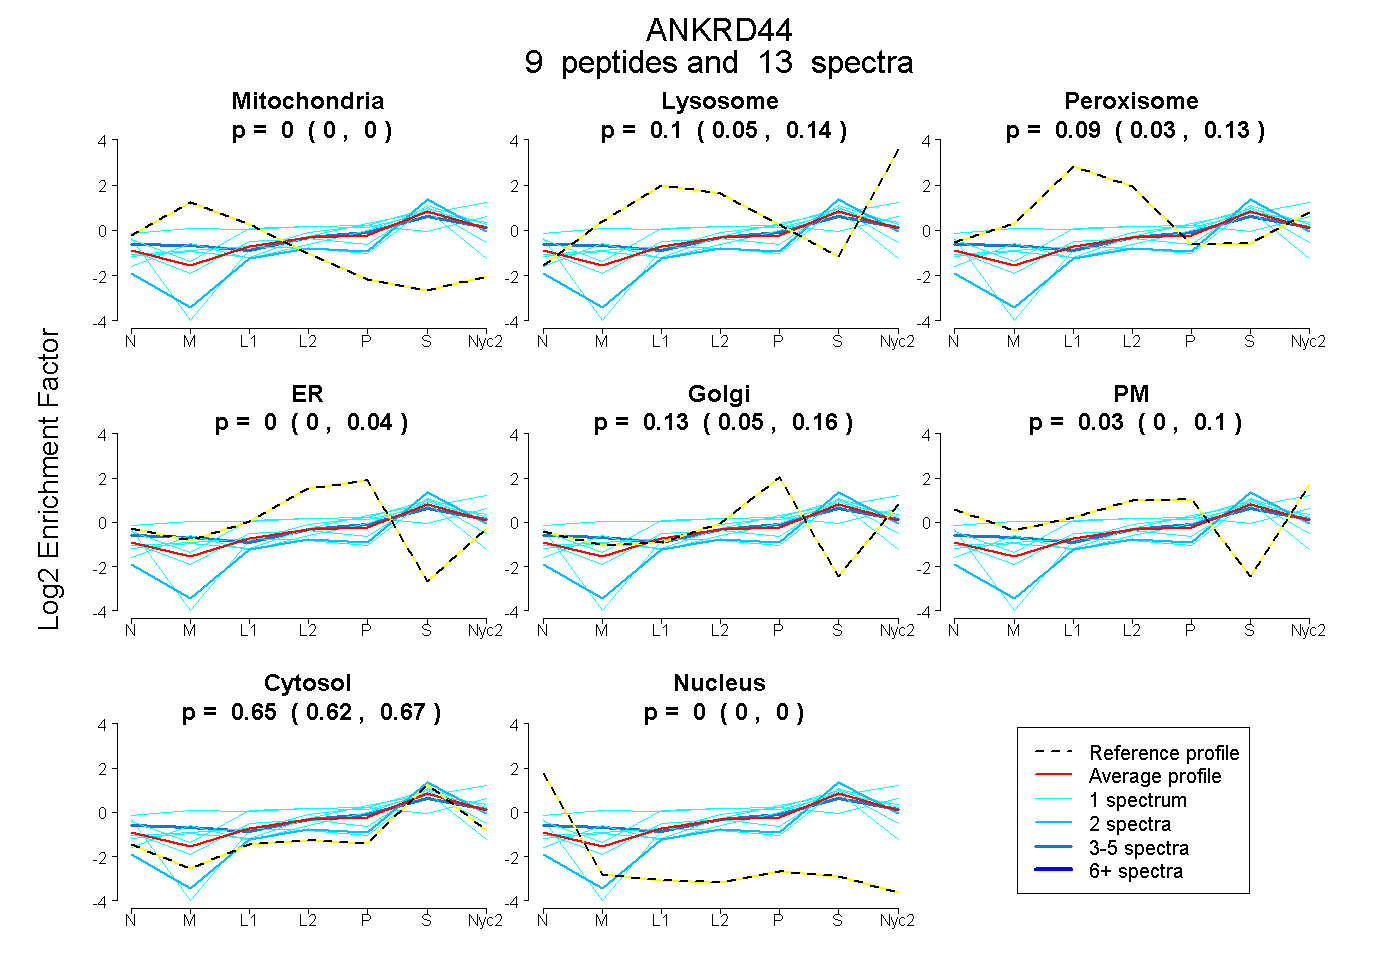
0.000 | 0.000
0.054 | 0.136
0.027 | 0.131
0.000 | 0.043
0.046 | 0.165
0.000 | 0.102
0.624 | 0.675
0.000 | 0.000
1peptide
spectrum
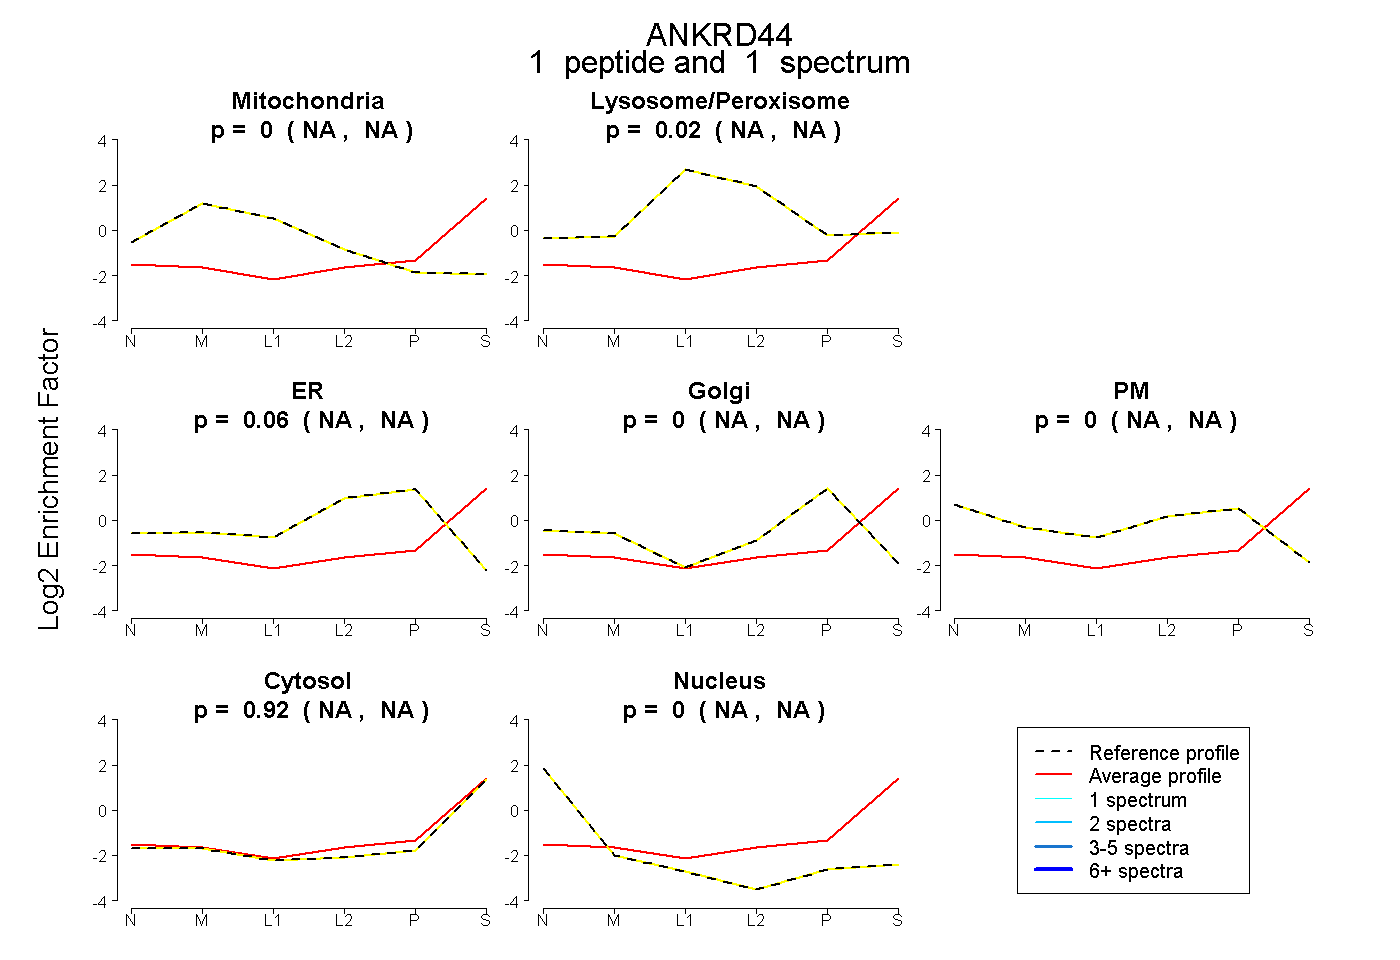
NA | NA
NA | NA
NA | NA
NA | NA
NA | NA
NA | NA
NA | NA
4peptides
spectra
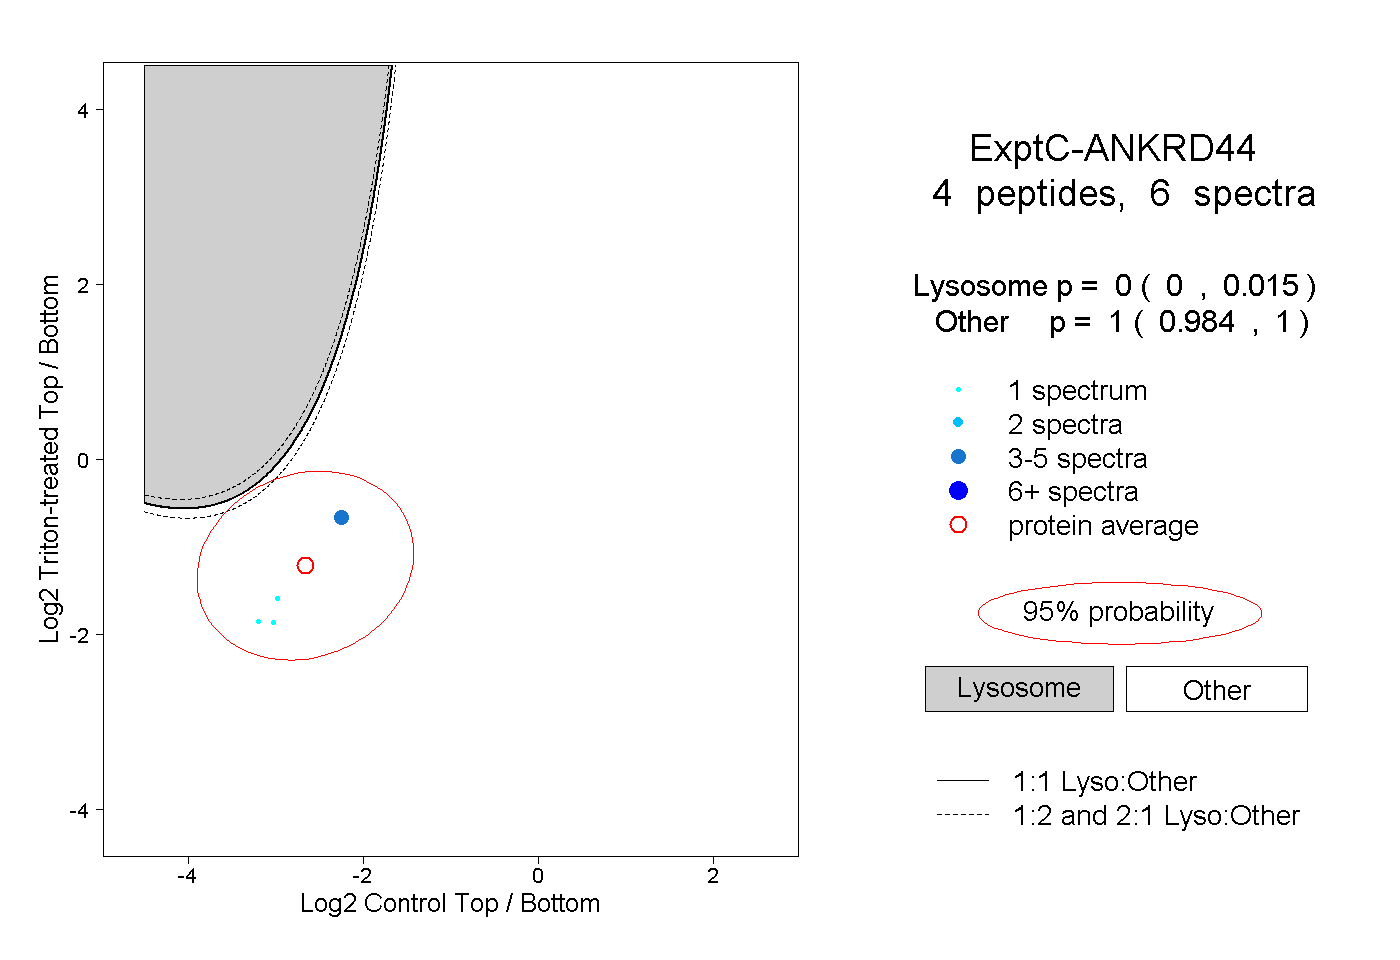
0.000 | 0.015
0.984 | 1.000