 44
44peptides
spectra
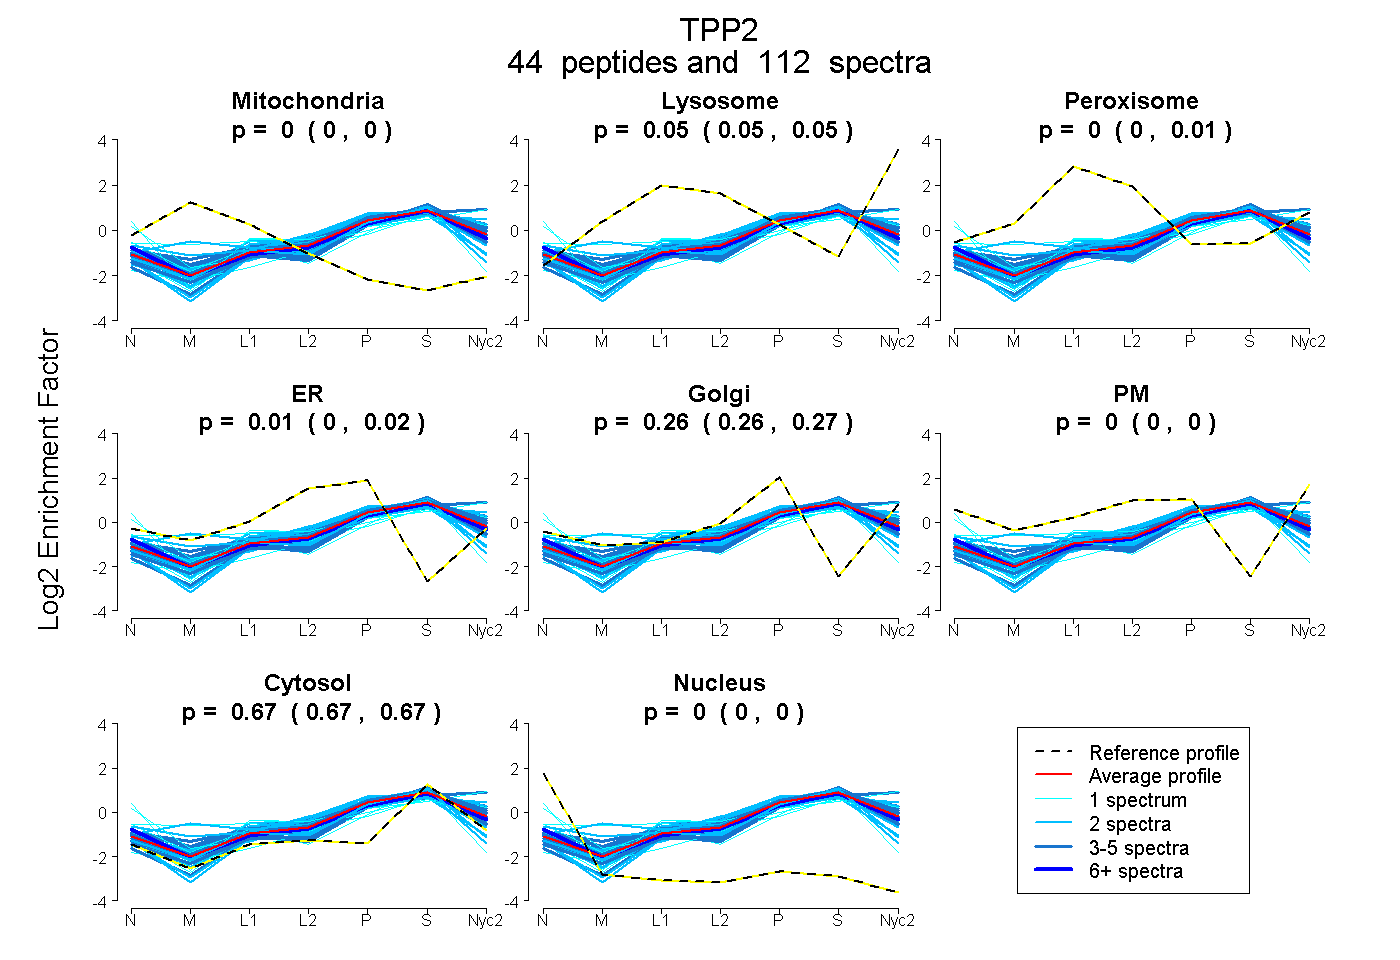
0.000 | 0.000
0.046 | 0.054
0.000 | 0.008
0.003 | 0.017
0.258 | 0.272
0.000 | 0.000
0.668 | 0.672
0.000 | 0.000
23peptides
spectra
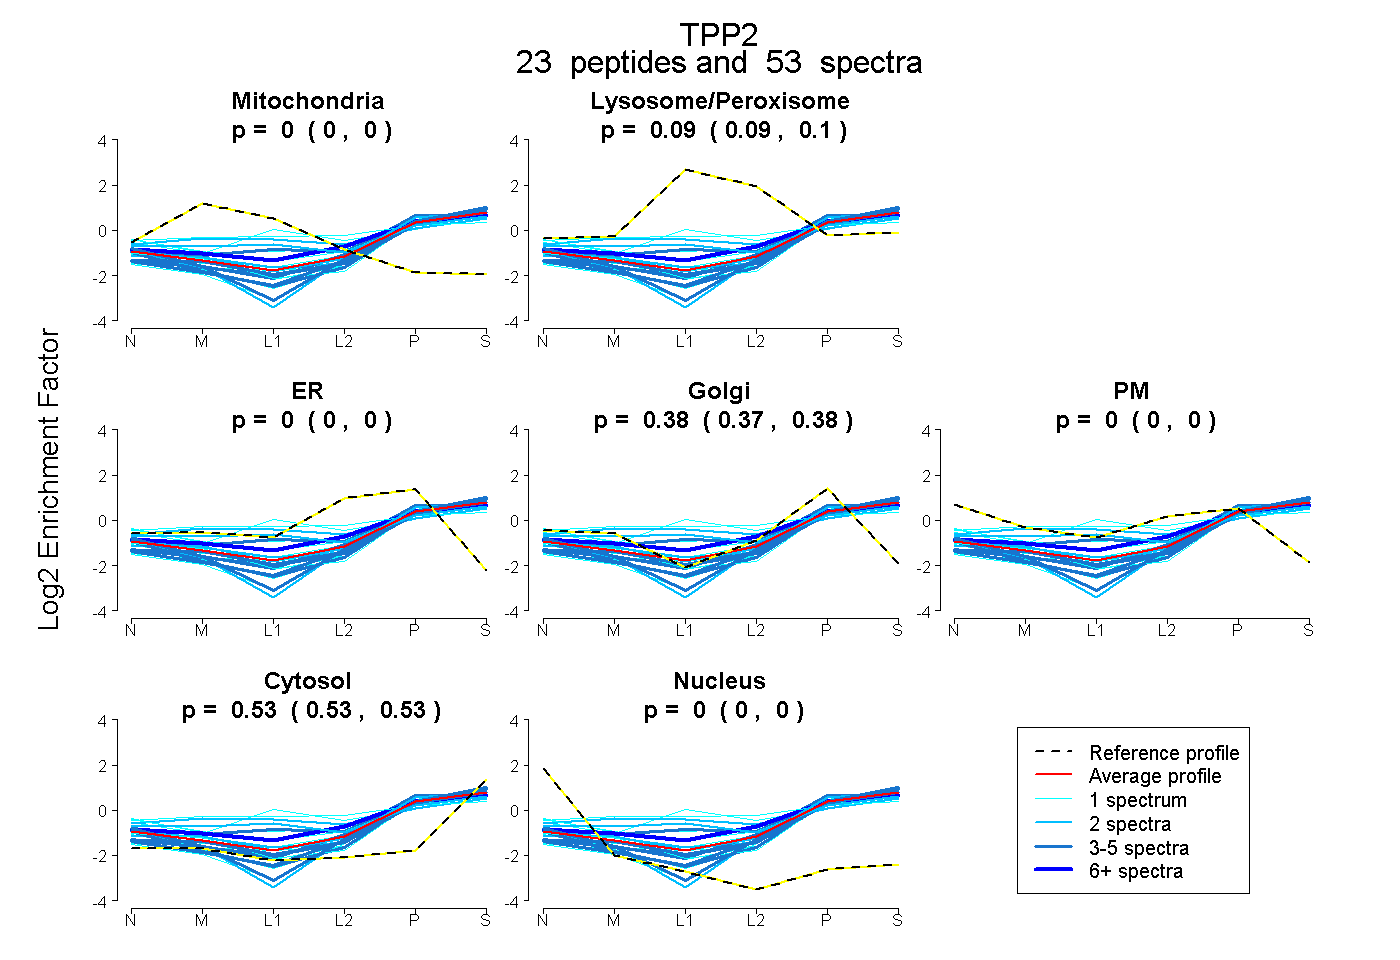
0.000 | 0.000
0.086 | 0.100
0.000 | 0.000
0.371 | 0.381
0.000 | 0.000
0.526 | 0.532
0.000 | 0.000
33peptides
spectra
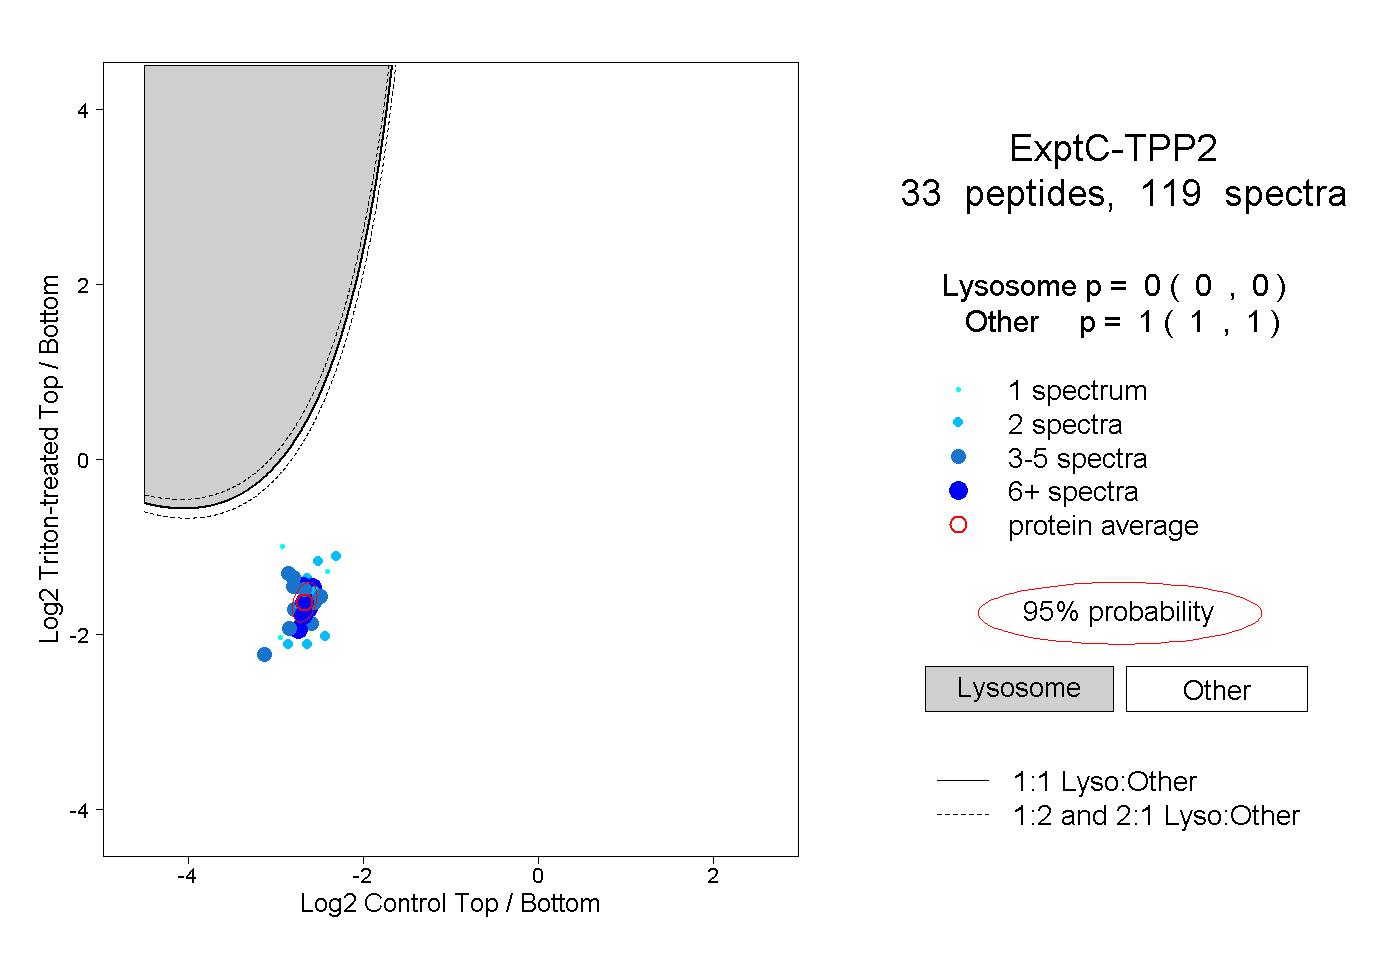
0.000 | 0.000
1.000 | 1.000
6peptides
spectra
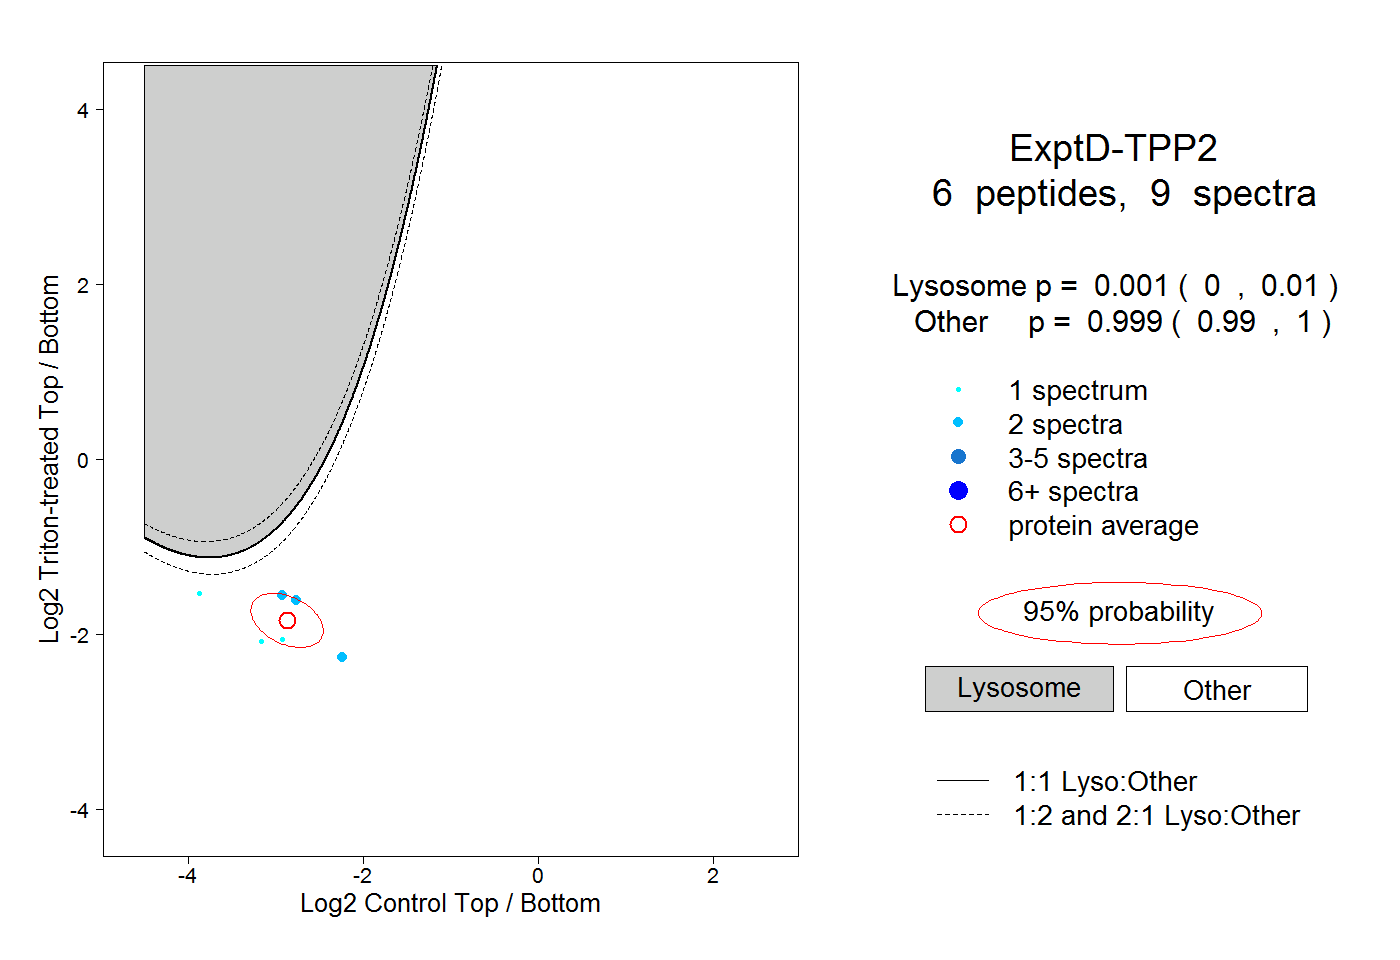
0.000 | 0.010
0.990 | 1.000