 5
5peptides
spectra
0.000 | 0.000
0.073 | 0.116
0.000 | 0.000
0.000 | 0.000
0.000 | 0.002
0.000 | 0.000
0.880 | 0.923
0.000 | 0.000
| Plot | Mito | Lyso | Perox | ER | Golgi | PM | Cytosol | Nucleus | |||||
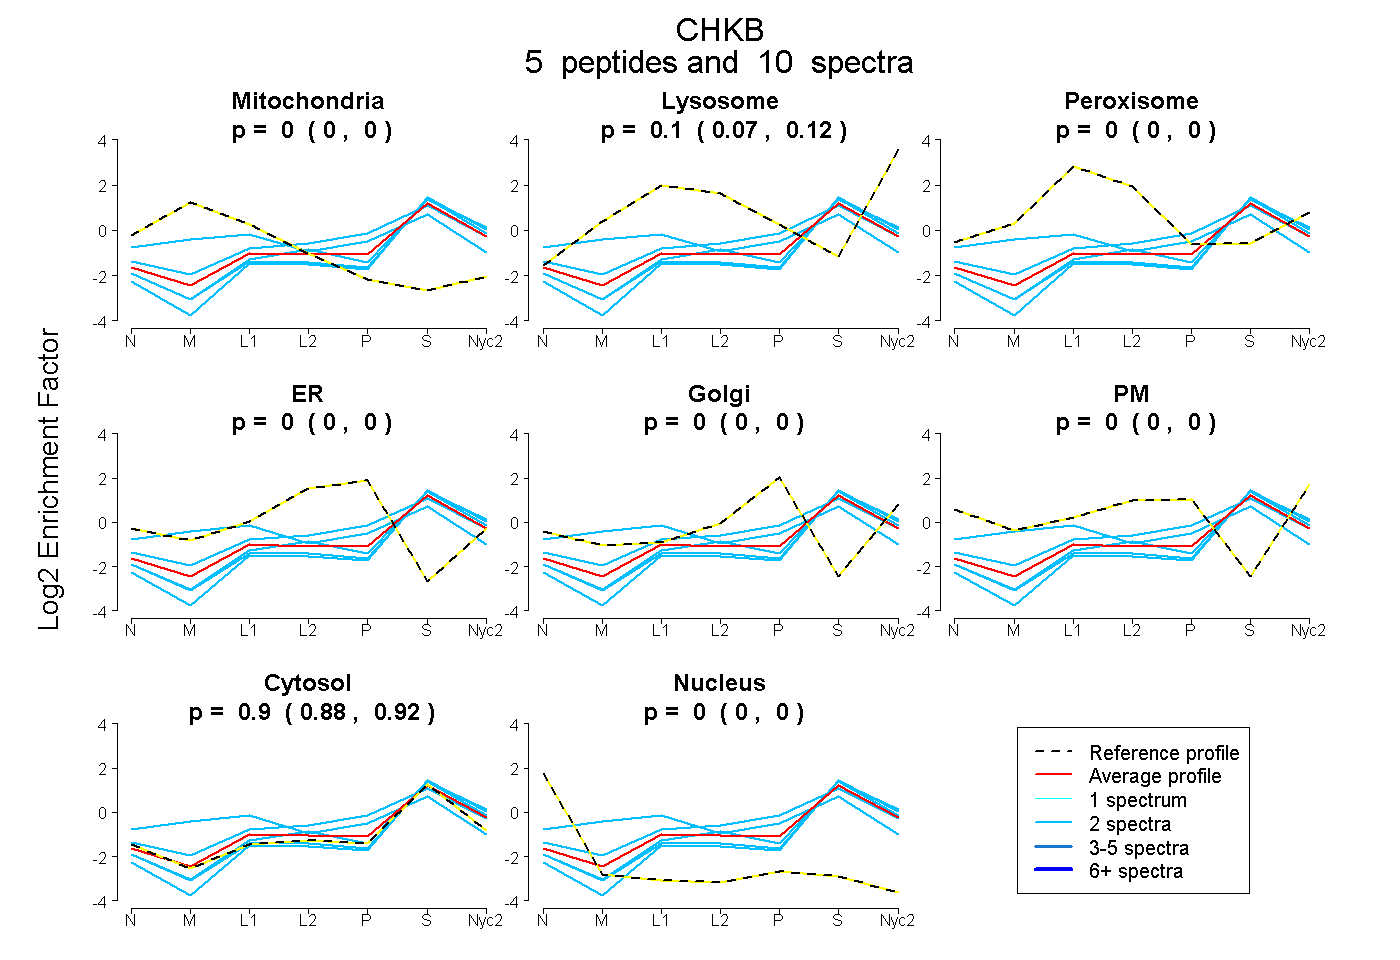
| Expt A |
5 peptides |
10 spectra |
|
0.000 0.000 | 0.000 |
0.098 0.073 | 0.116 |
0.000 0.000 | 0.000 |
0.000 0.000 | 0.000 |
0.000 0.000 | 0.002 |
0.000 0.000 | 0.000 |
0.902 0.880 | 0.923 |
0.000 0.000 | 0.000 |
| 2 spectra, GEVLSEEEQK | 0.000 | 0.116 | 0.000 | 0.098 | 0.027 | 0.000 | 0.758 | 0.000 | ||
| 2 spectra, EYLGGAWR | 0.000 | 0.008 | 0.000 | 0.000 | 0.000 | 0.000 | 0.992 | 0.000 | ||
| 2 spectra, EQQLLFIR | 0.000 | 0.000 | 0.000 | 0.000 | 0.000 | 0.000 | 1.000 | 0.000 | ||
| 2 spectra, HYLAEVQK | 0.196 | 0.000 | 0.198 | 0.000 | 0.048 | 0.000 | 0.557 | 0.000 | ||
| 2 spectra, LEQYLPSRPLK | 0.000 | 0.074 | 0.000 | 0.000 | 0.000 | 0.000 | 0.926 | 0.000 |
| Plot | Mito | Lyso or Perox | ER | Golgi | PM | Cytosol | Nucleus | ||||||
| Expt B |
1 peptide |
1 spectrum |
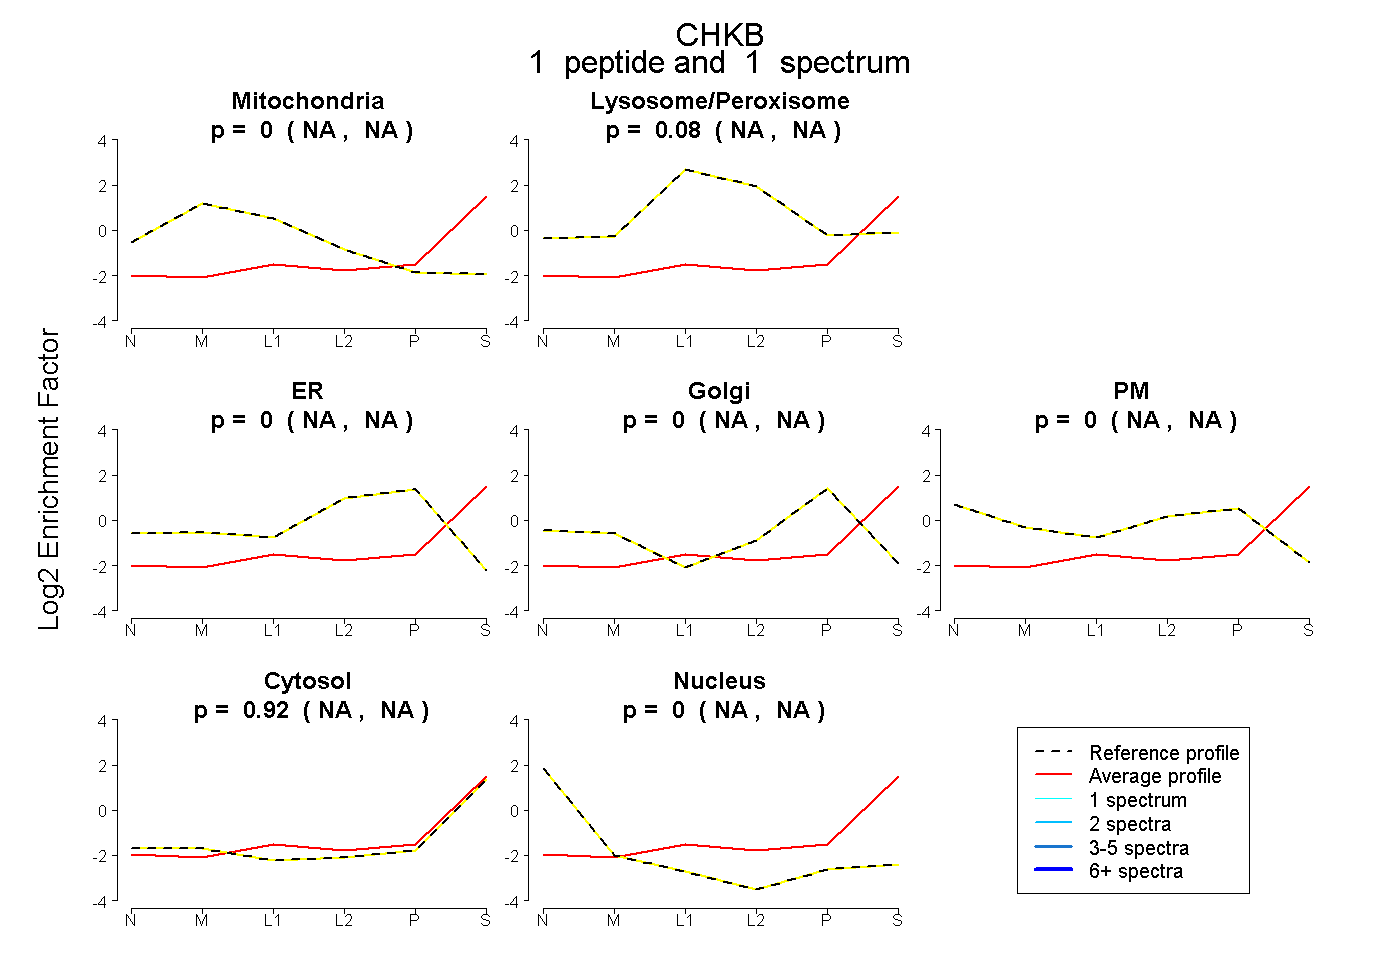 |
0.000 NA | NA |
0.082 NA | NA |
0.000 NA | NA |
0.000 NA | NA |
0.000 NA | NA |
0.918 NA | NA |
0.000 NA | NA |
|||
| Plot | Lyso | Other | |||||||||||
| Expt C |
5 peptides |
9 spectra |
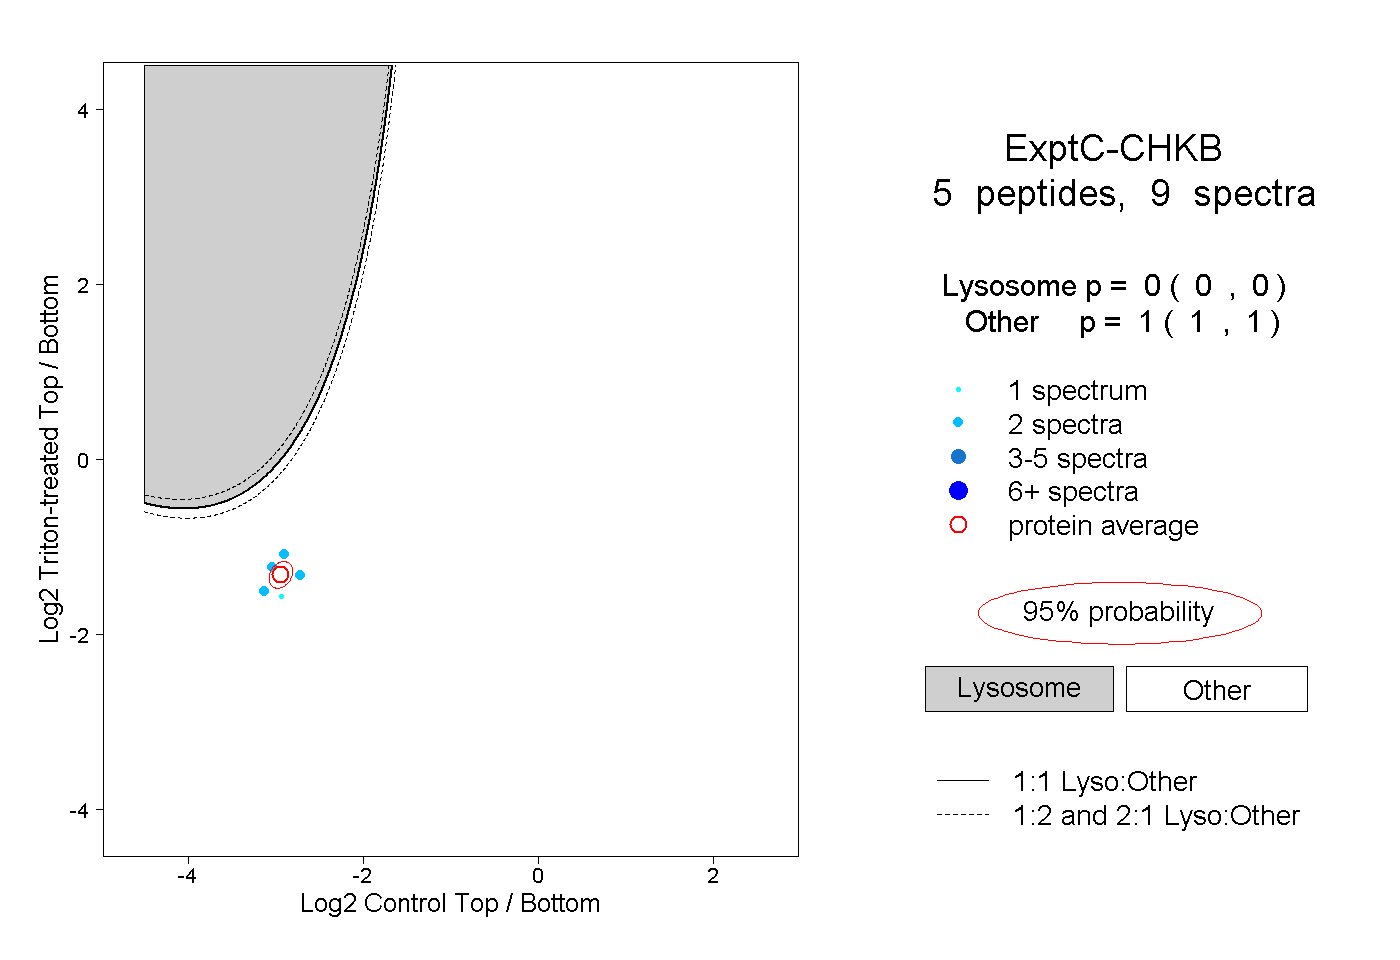 |
0.000 0.000 | 0.000 |
1.000 1.000 | 1.000 |