17
17peptides
spectra
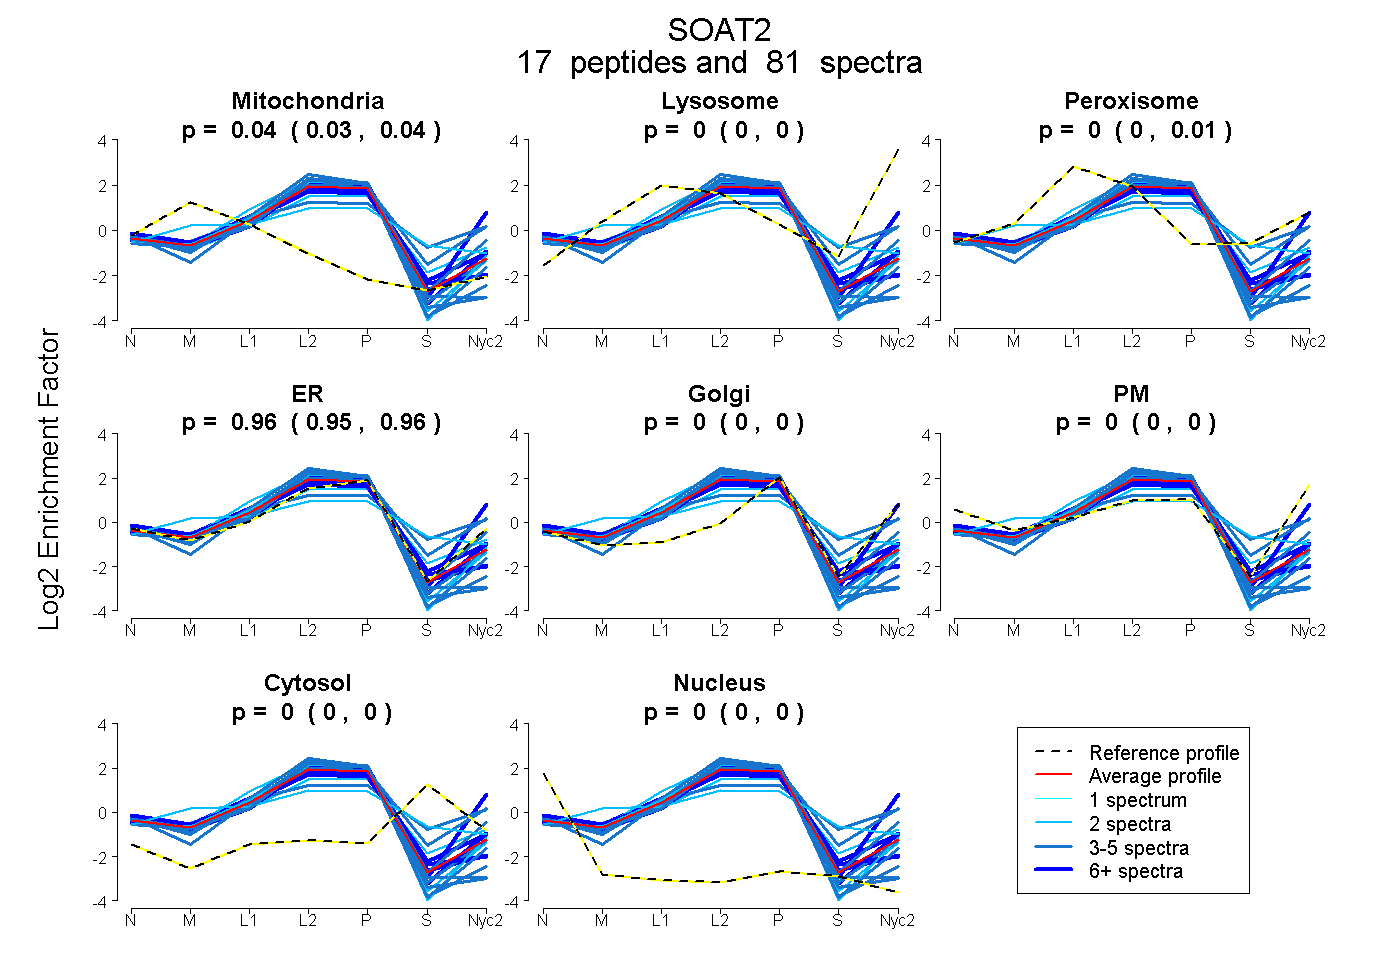
0.035 | 0.045
0.000 | 0.000
0.000 | 0.008
0.953 | 0.961
0.000 | 0.000
0.000 | 0.000
0.000 | 0.000
0.000 | 0.000
12peptides
spectra
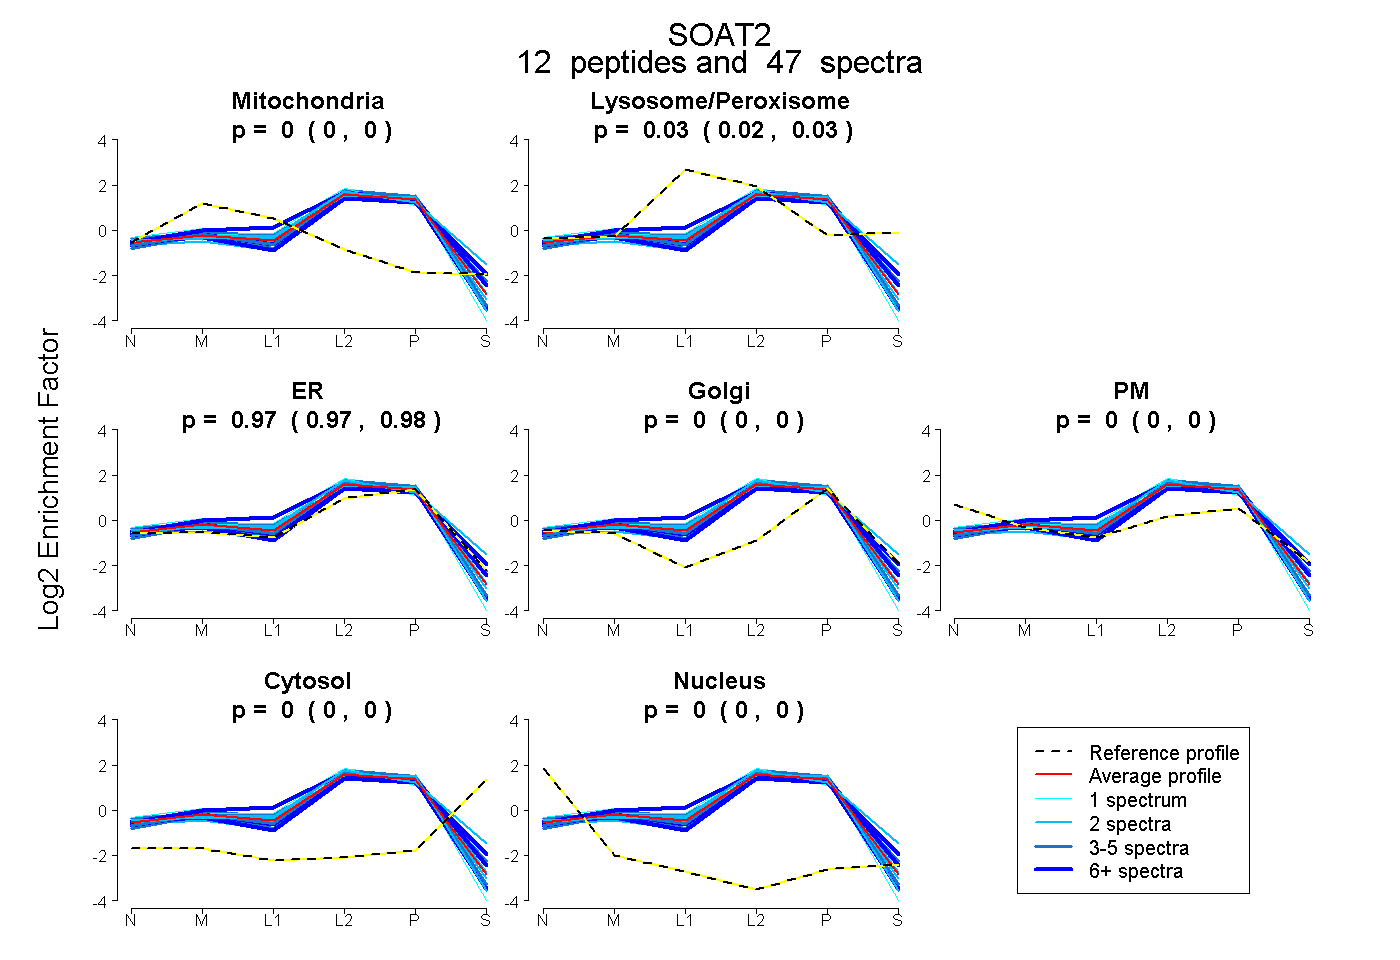
0.000 | 0.000
0.018 | 0.032
0.967 | 0.981
0.000 | 0.000
0.000 | 0.000
0.000 | 0.000
0.000 | 0.000