 4
4peptides
spectra
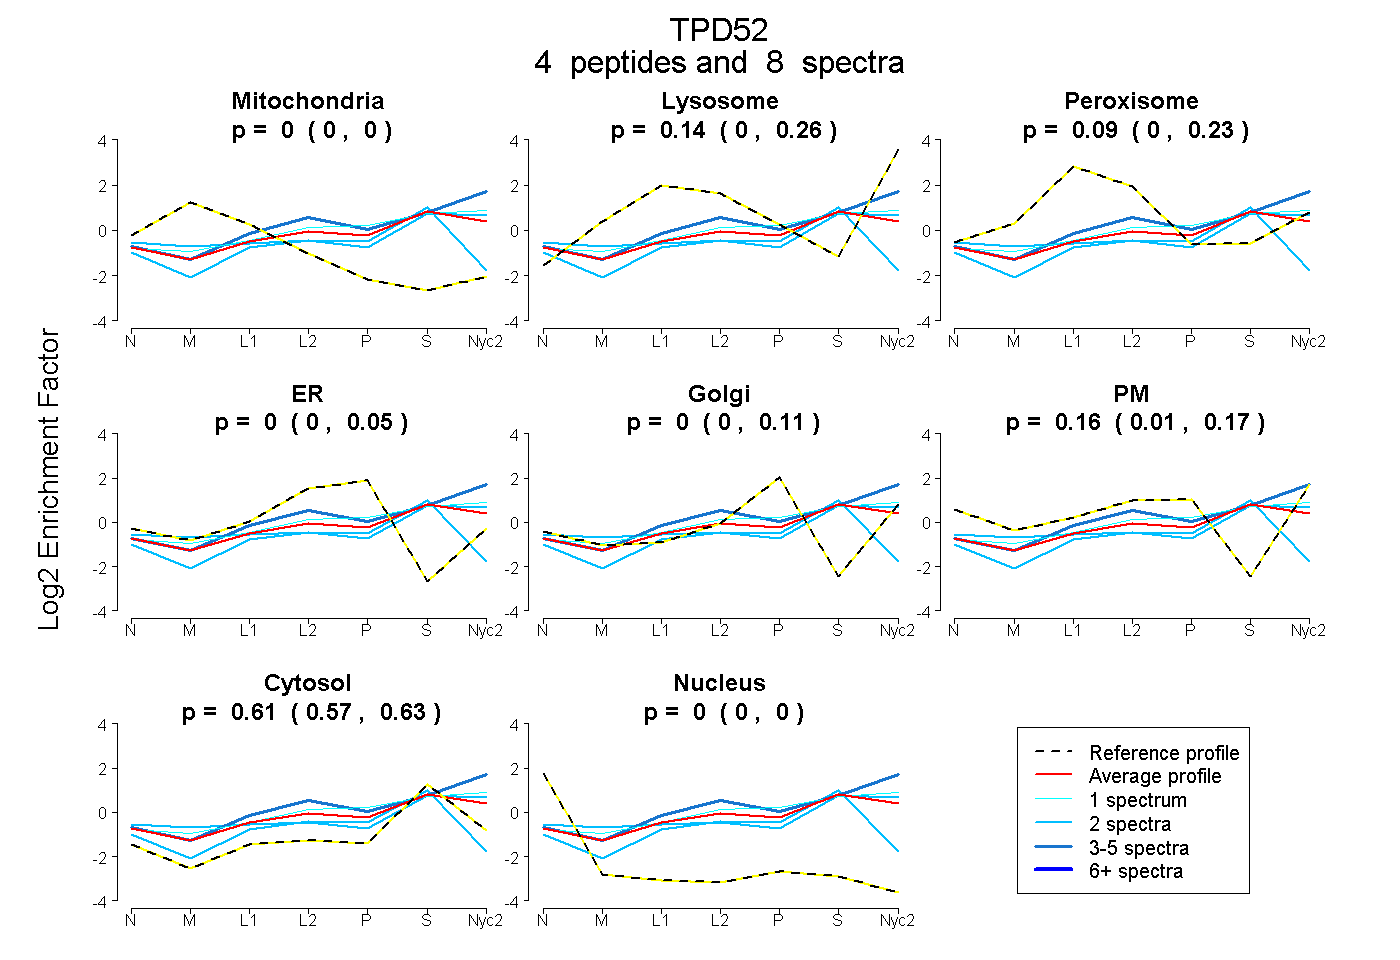
0.000 | 0.000
0.000 | 0.259
0.000 | 0.228
0.000 | 0.053
0.000 | 0.112
0.012 | 0.169
0.570 | 0.626
0.000 | 0.000
2peptides
spectra
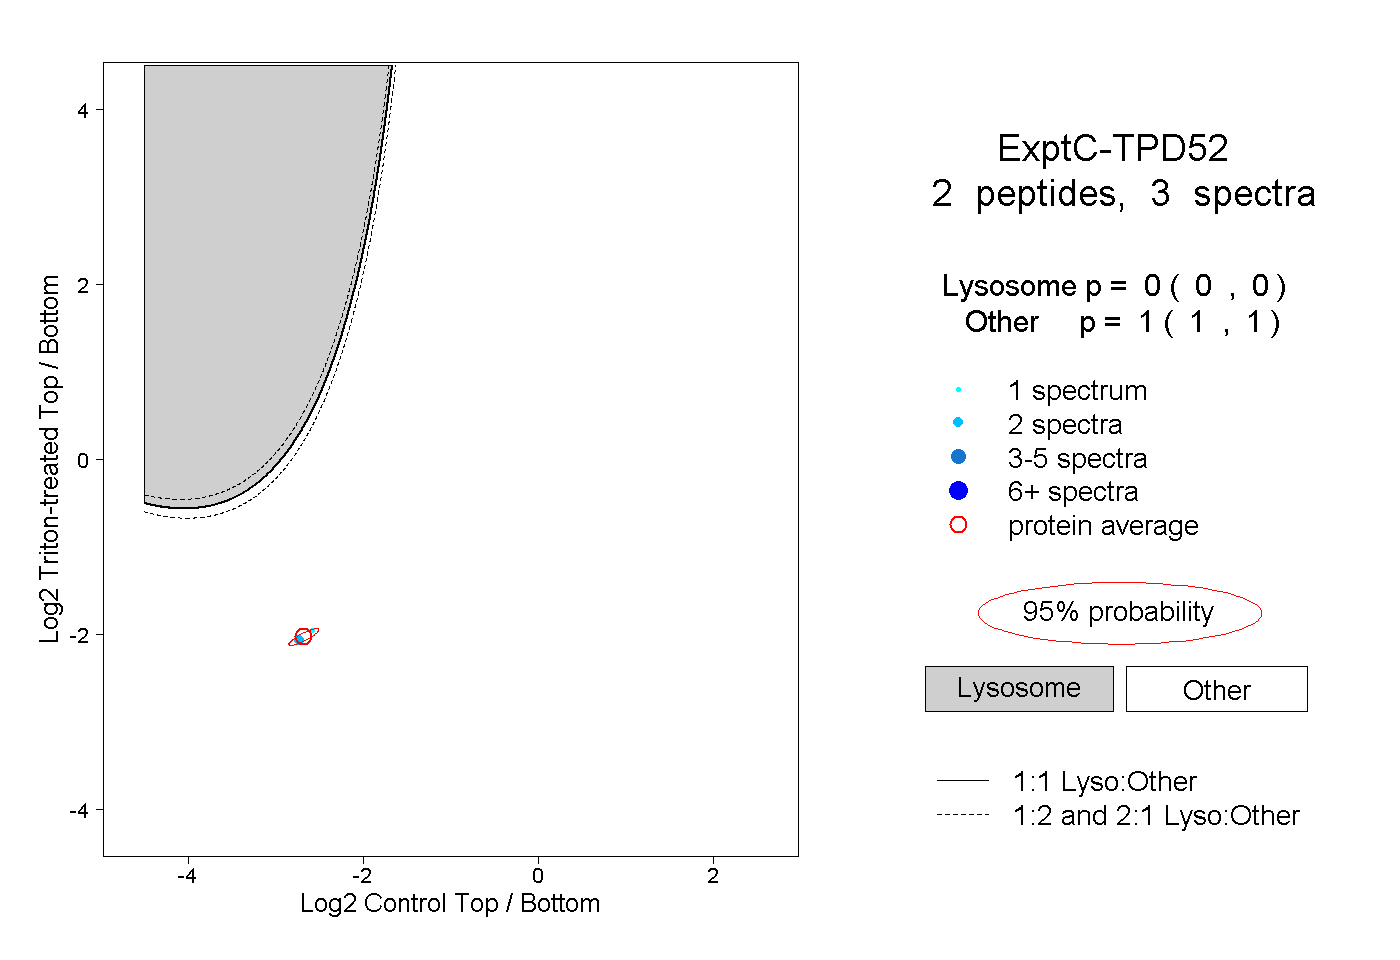
0.000 | 0.000
1.000 | 1.000
| Plot | Mito | Lyso | Perox | ER | Golgi | PM | Cytosol | Nucleus | |||||
| Expt A |
4 peptides |
8 spectra |
|
0.000 0.000 | 0.000 |
0.143 0.000 | 0.259 |
0.088 0.000 | 0.228 |
0.000 0.000 | 0.053 |
0.000 0.000 | 0.112 |
0.159 0.012 | 0.169 |
0.609 0.570 | 0.626 |
0.000 0.000 | 0.000 |
||
| Plot | Lyso | Other | |||||||||||
| Expt C |
2 peptides |
3 spectra |
|
0.000 0.000 | 0.000 |
1.000 1.000 | 1.000 |