 3
3peptides
spectra
0.000 | 0.023
0.000 | 0.000
0.088 | 0.210
0.000 | 0.019
0.000 | 0.163
0.324 | 0.574
0.256 | 0.337
0.000 | 0.000
2peptides
spectra
0.000 | 0.001
0.999 | 1.000
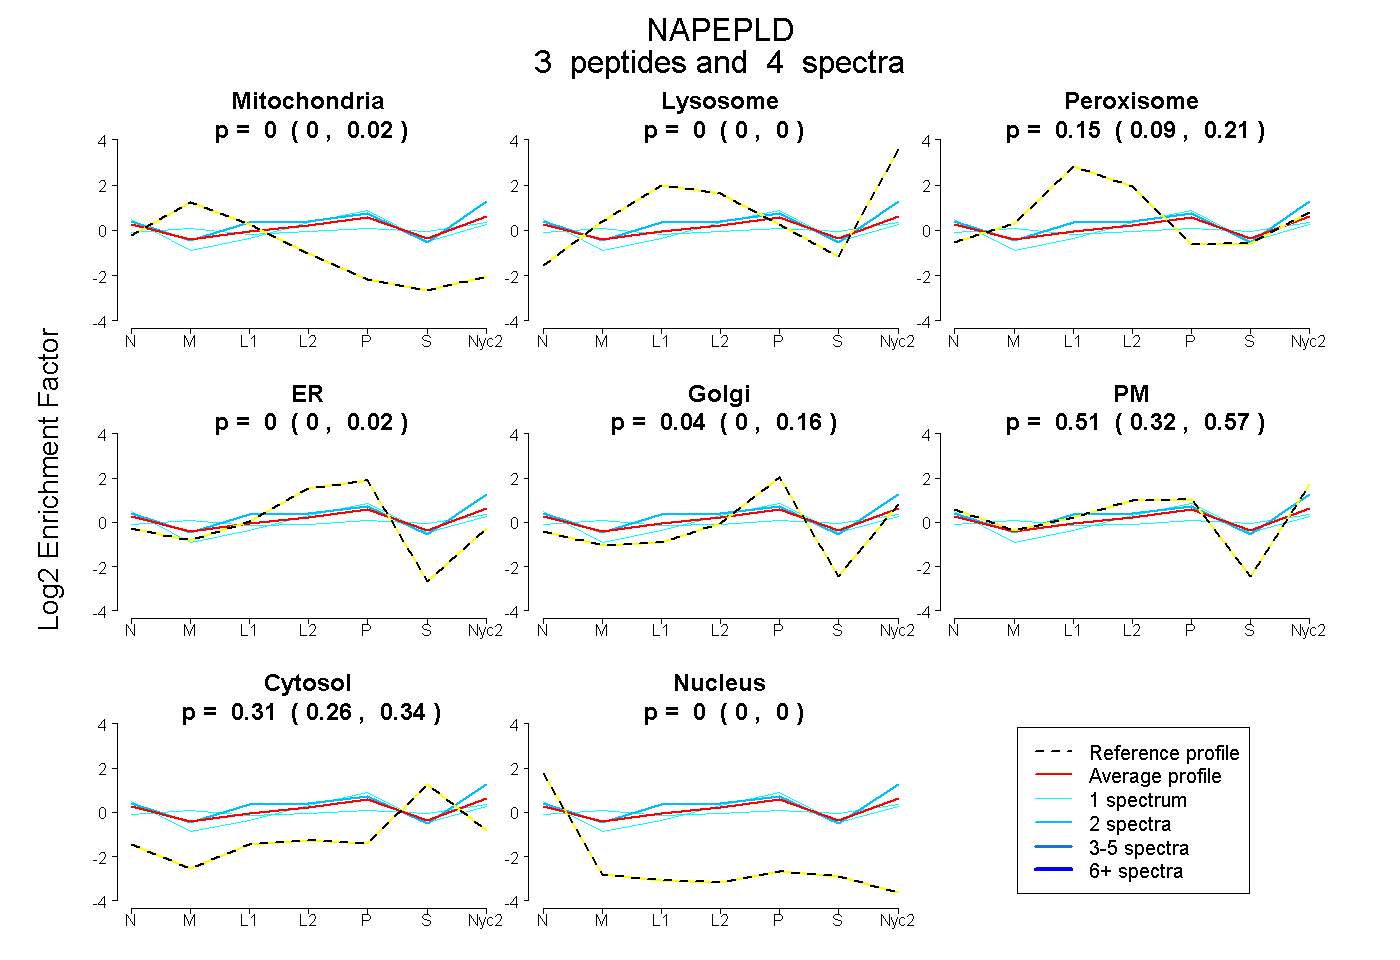
| Plot | Mito | Lyso | Perox | ER | Golgi | PM | Cytosol | Nucleus | |||||
| Expt A |
3 peptides |
4 spectra |
|
0.000 0.000 | 0.023 |
0.000 0.000 | 0.000 |
0.150 0.088 | 0.210 |
0.000 0.000 | 0.019 |
0.035 0.000 | 0.163 |
0.507 0.324 | 0.574 |
0.308 0.256 | 0.337 |
0.000 0.000 | 0.000 |
||
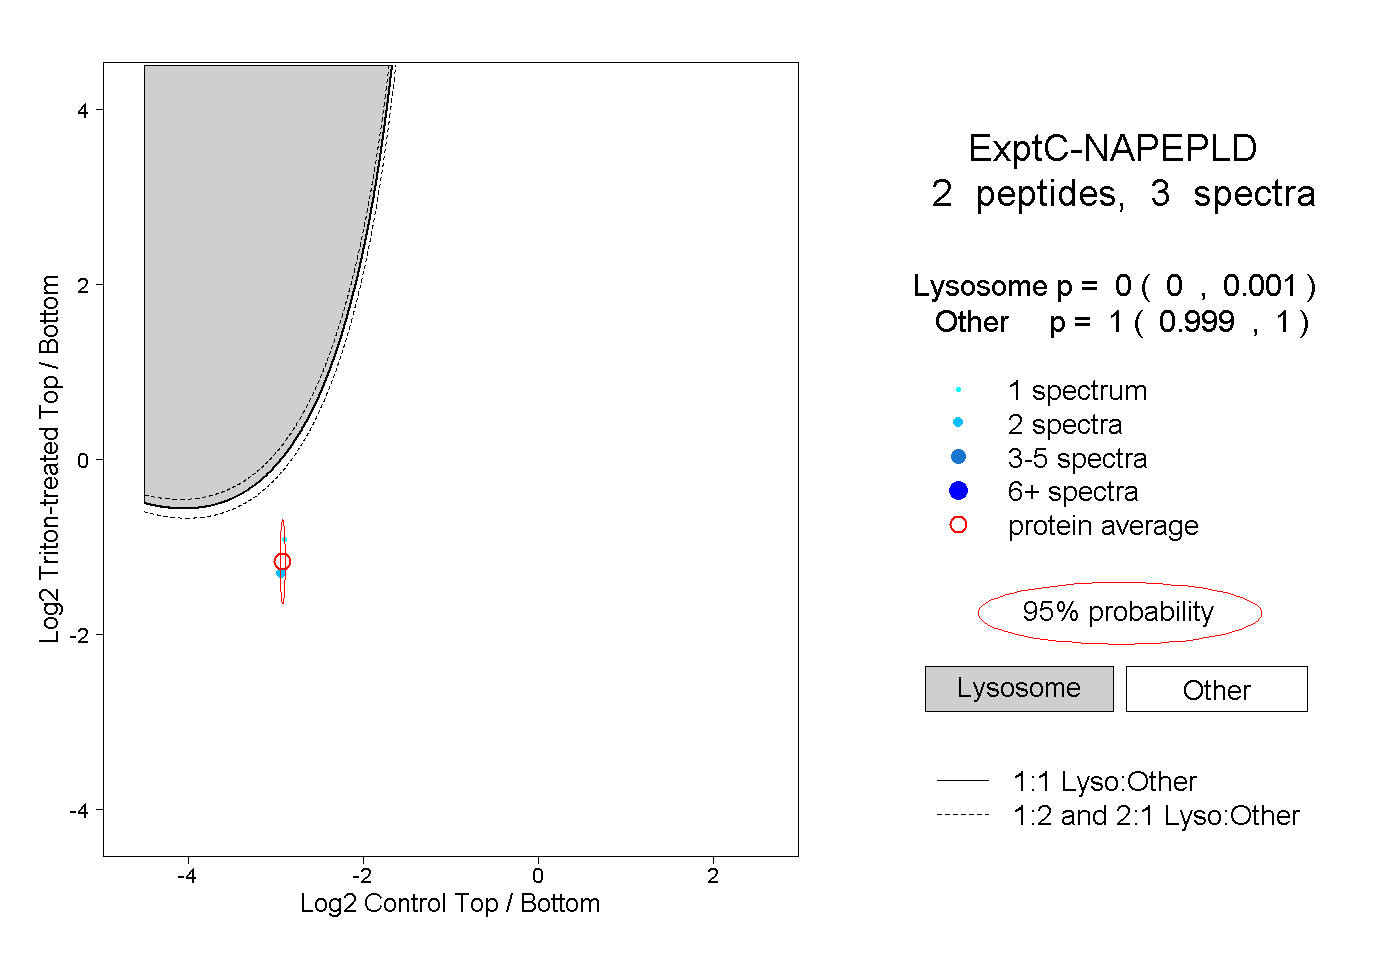
| Plot | Lyso | Other | |||||||||||
| Expt C |
2 peptides |
3 spectra |
|
0.000 0.000 | 0.001 |
1.000 0.999 | 1.000 |