 2
2peptides
spectra
0.000 | 0.176
0.000 | 0.175
0.000 | 0.170
0.000 | 0.098
0.000 | 0.068
0.000 | 0.000
0.741 | 0.815
0.000 | 0.000
| Plot | Mito | Lyso | Perox | ER | Golgi | PM | Cytosol | Nucleus | |||||
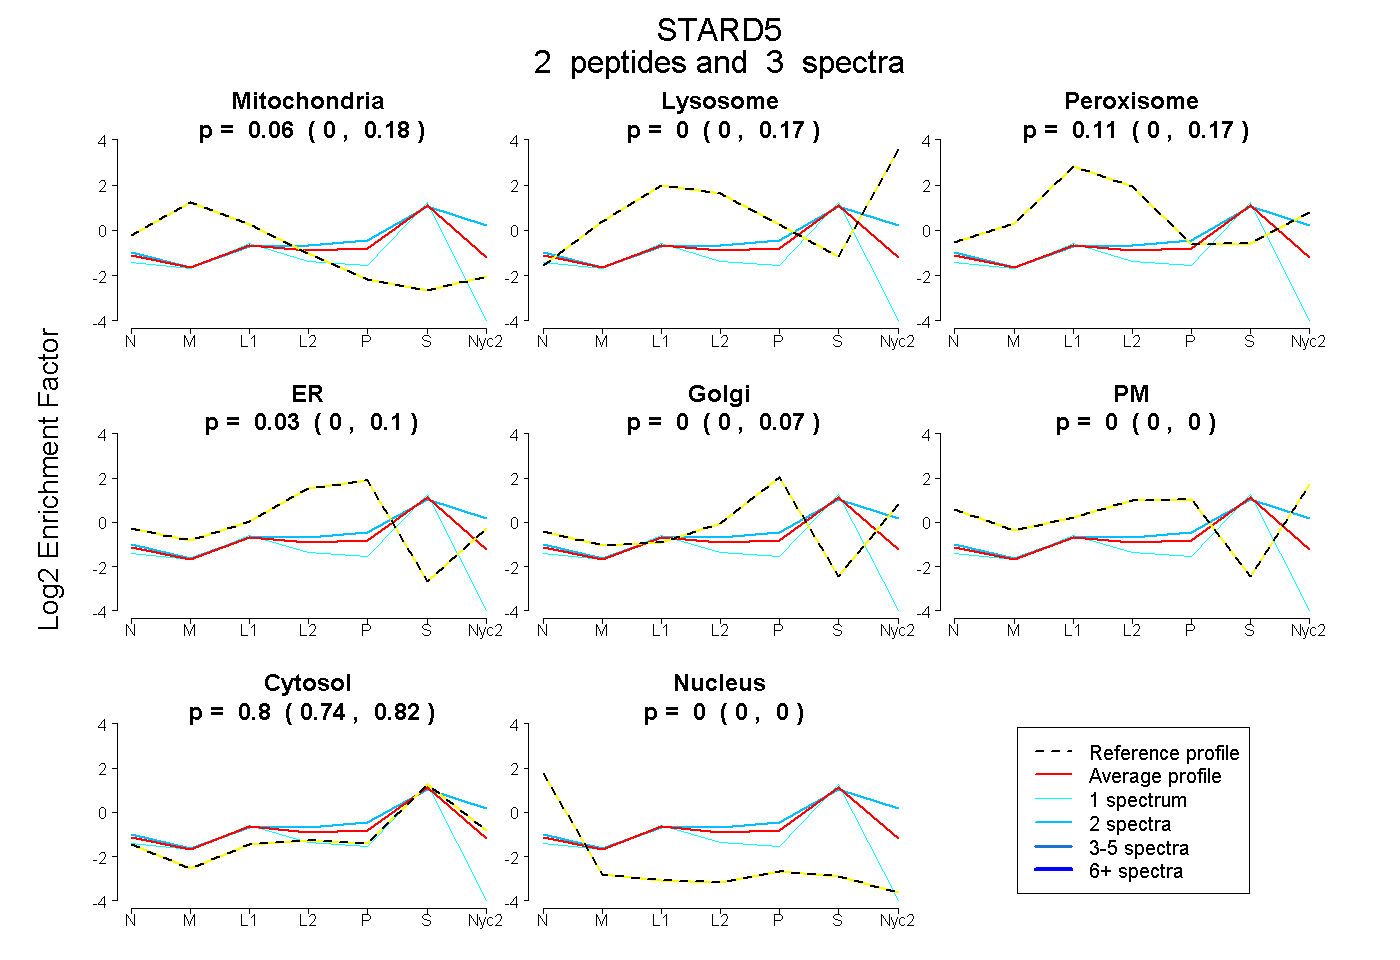
| Expt A |
2 peptides |
3 spectra |
|
0.061 0.000 | 0.176 |
0.000 0.000 | 0.175 |
0.110 0.000 | 0.170 |
0.034 0.000 | 0.098 |
0.000 0.000 | 0.068 |
0.000 0.000 | 0.000 |
0.795 0.741 | 0.815 |
0.000 0.000 | 0.000 |
| 2 spectra, TSTPSAAMK | 0.000 | 0.168 | 0.015 | 0.000 | 0.036 | 0.051 | 0.730 | 0.000 | ||
| 1 spectrum, DFVDLVLVK | 0.189 | 0.000 | 0.000 | 0.000 | 0.000 | 0.000 | 0.720 | 0.091 |
| Plot | Lyso | Other | |||||||||||
| Expt C |
4 peptides |
8 spectra |
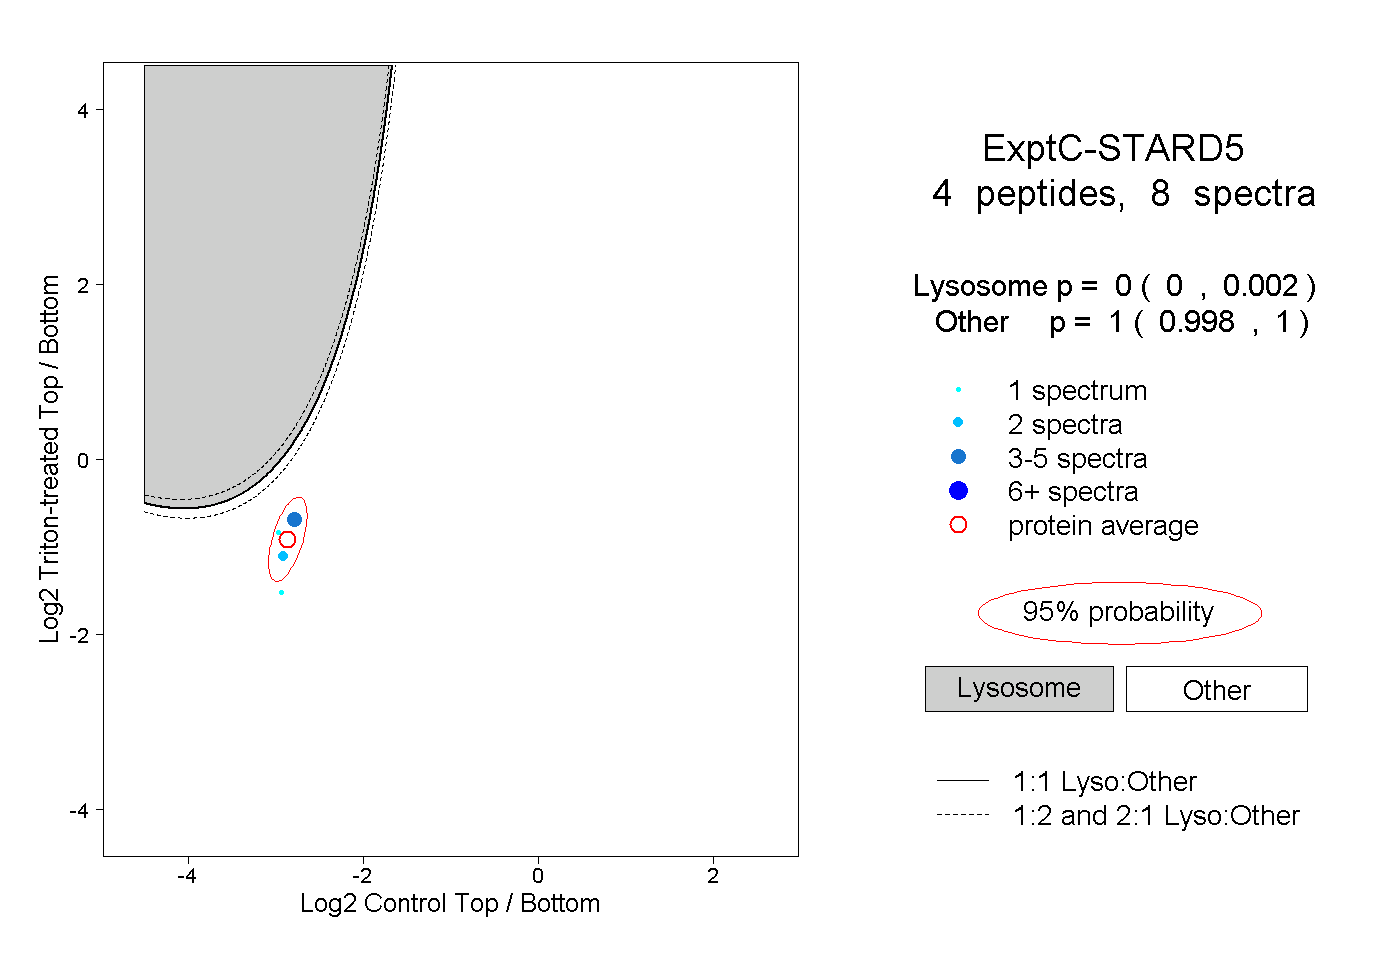 |
0.000 0.000 | 0.002 |
1.000 0.998 | 1.000 |
||||||||
| Plot | Lyso | Other | |||||||||||
| Expt D |
1 peptide |
3 spectra |
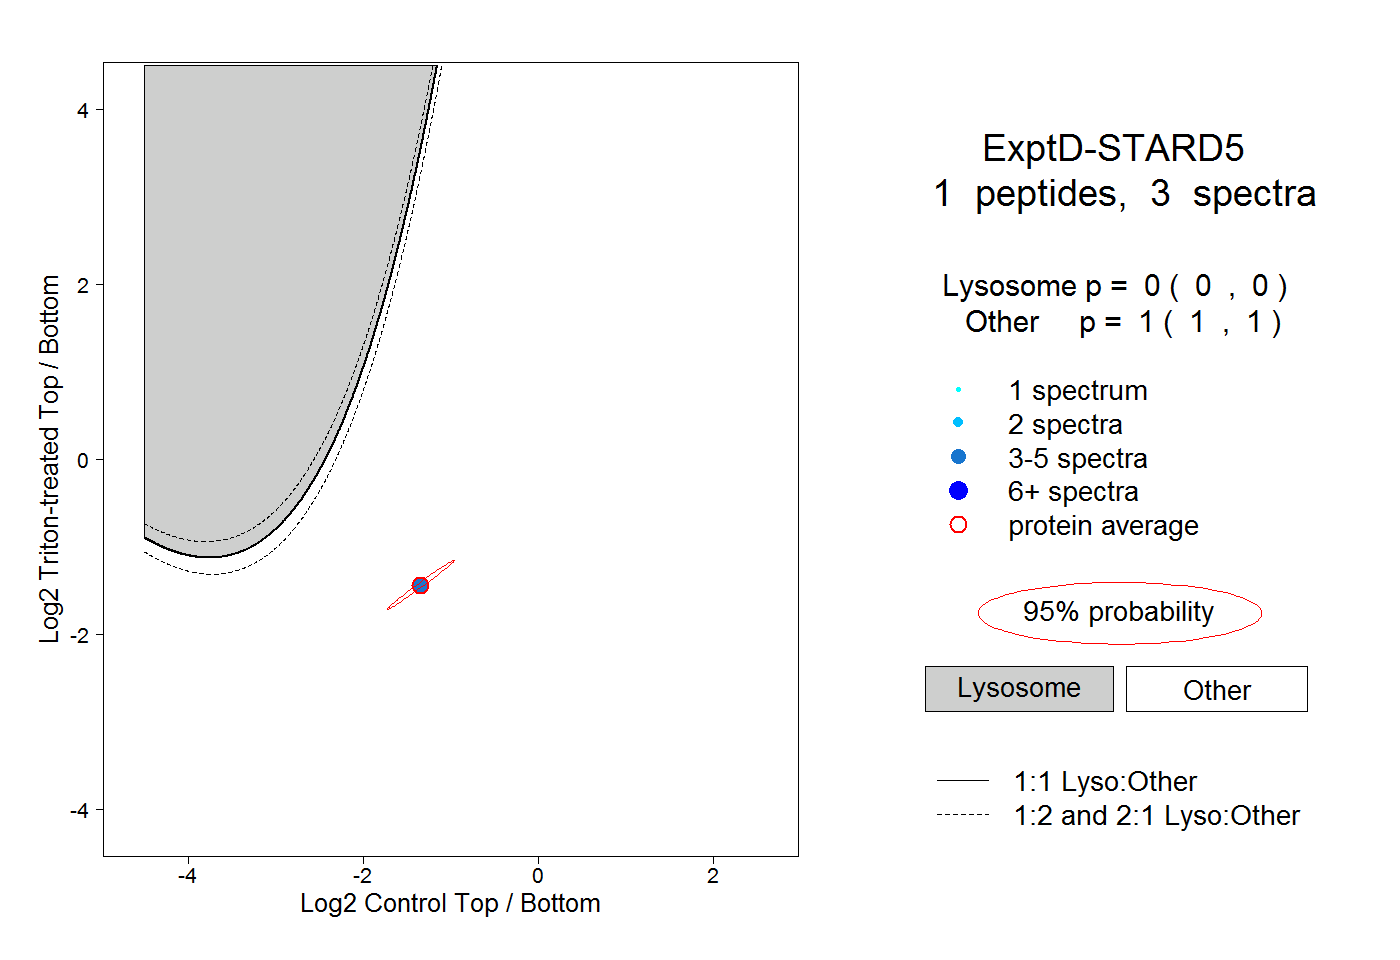 |
0.000 0.000 | 0.000 |
1.000 1.000 | 1.000 |